
This section contains information on standard errors and design effects for the NLSY79 sample, briefly discussing how to use these two statistical factors. It then includes tables for the first round and for 1996 through 2022. Users interested in the intervening years should review the Technical Sampling Report and Technical Sampling Report Addendum.
Standard errors have been explicitly computed for a number of statistics based upon the entire NLSY79 sample (total, civilian, and military) and a number of sex or race subclasses. Standard errors for other statistics (defined over the entire sample or the subclasses) may be approximated with use of the DEFT factors given in the linked tables. Users who examine the tables will note that CHRR has calculated standard errors for different variables over time.
Approximate standard errors: Percentages
The following formula approximates a standard error of a percentage:

where
se(P) = the approximate standard error for the percentage of P
P = the sample percentage (ranging from 0 to 100)
n = the actual unweighted sample size for the demographic subclass from which the percentage was developed
DEFT = the appropriate DEFT factor for the particular demographic subclass and sample type from which the percentage was developed
For example, for 1996 the appropriate DEFT factor for estimating a standard error of the percentage of Hispanic or Latino males who were high school dropouts is 1.17744 (see proportion column, row seven of Table 2. Deft factors for round 17, 1996). Assuming the calculated sample (P) equals 22.19 percent and the unweighted sample estimate size is 946, then:
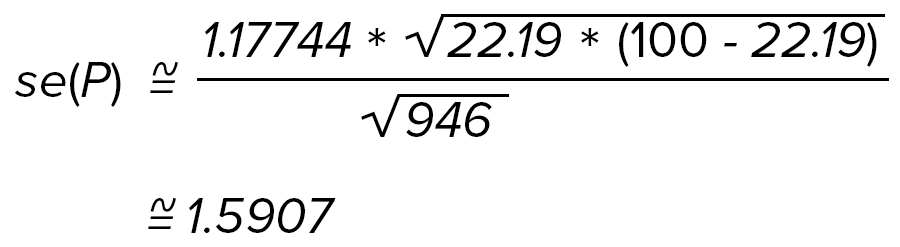
To approximate the standard error of the corresponding projected population total (NP/100), calculate:
![se(NP divided by 100) approximately equal to N[se(P) divided by 100]](/sites/default/files/attachments/121029/equat3.png)
where
se(NP/100) = the approximate standard error of the projected population total corresponding to a percentage P within a particular demographic subclass and sample type
N = the appropriate projected total population base for the particular demographic subclass and sample type
For example, if the projected total population base for Hispanic or Latino males is 1,030,861, the projected number of civilian Hispanic or Latino male high school dropouts is equal to NP/100 or 1,030,861 * 22.19/100 = 228,748. Thus, the approximate standard error for the total number of Hispanic or Latino male high school dropouts is:
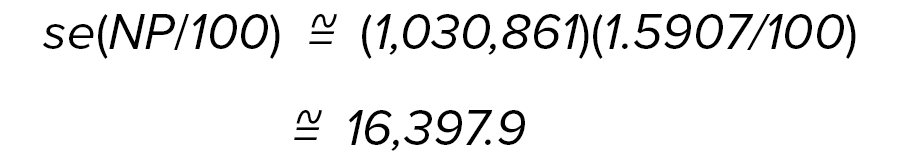
Note: 1.5907 came from the previous calculation.
Approximate standard errors: Means
One can compute approximate standard errors for means as follows:

where
se(X) = the approximate standard error of the mean
DEFT = the appropriate DEFT factor for the particular demographic subclass and sample type from which the mean was developed
S2 = the weighted element variance computed for the demographic subclass and sample type from which the mean was developed
n = the unweighted sample size for the particular mean
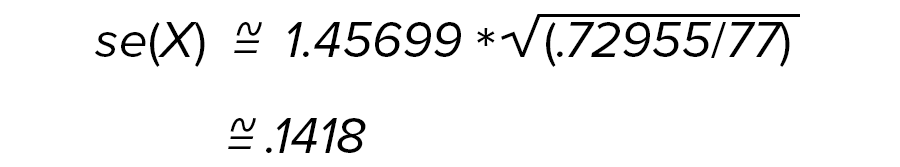
For example, for 1979 the DEFT factor for all Hispanics or Latinos is 1.45699 (see means column, row four of Table 1. Deft factors for round 1, 1979). To approximate the standard error of the mean number of years of education completed by this subclass, where the weighted element variance is .72955 and the sample size is 77, compute:
Design effects
Because the samples are multi-stage, stratified random samples instead of simple random samples, respondents tend to come in geographic clusters and clusters of persons tend to be alike in a variety of ways for a variety of reasons. (For more information on the sampling and screening process, users are referred to section on Sample Design & Screening Process in this guide.) For example, there may be cultural differences by locality or ecological differences in labor market conditions. Depending upon the degree of this homogeneity, the conventionally computed standard deviations for the variables, which assume a simple random sample, may be too small. However, by controlling the rate at which particular strata are sampled, multi-stage, stratified random samples can improve upon simple random samples. The ratio of the correct standard error to the standard error computed under the assumption of a simple random sample is known as the design effect. The technical sampling report for the NLSY79 (Frankel, Williams, and Spencer 1983) and its addendum (CHRR) provide design effects for the various strata.
A single design effect that can be broadly applied to regression analysis cannot be constructed. To illustrate the approximate size of design effects in regression analysis, a regression of rate of pay for the CPS job in 1979 was estimated using race, sex, marital status, and education as explanatory variables. Assuming each of the roughly 200 PSUs has the same number of respondents in the sample of 5,724 persons with observed wages, the design effect was calculated to be 1.52; that is, the true standard errors were larger than the naively computed standard errors by a factor of 1.52. When this exercise was repeated for rate of pay on the CPS job in 1986, the design effect had fallen to 1.37.
This reduction reflects the fact that mobility tends to mix the respondents more uniformly through the country, reducing the clustering of the sample. Many of the persons who started out in the same PSU will have moved to different areas and, hence, no longer share unobservable labor market conditions. These shared unobservable labor market conditions are likely responsible for the spatial correlation of the error terms which generate design effects. Thus, another advantage of longitudinal data is the lessening of design effects over time.
By examining the Geocode data for the NLSY79, it is possible to control for some of the environmental factors generating design effects or, if desired, to compute design effects based upon county or metropolitan area clusters which continue to be present. To facilitate study of design effects, scrambled PSU codes from the 1979 survey are available to persons with authorized access to the NLSY79 Geocode data.
The Technical Sampling Report and Technical Sampling Report Addendum also provide information on design effects.
Click below to view the DEFT and standard errors tables.
|
Demographic Group |
Proportions | Means |
|---|---|---|
|
All Youth |
1.72547 | 1.71282 |
|
Males |
1.46605 | 1.56808 |
|
Females |
1.58029 | 1.49720 |
|
Hispanics or Latinos |
1.44342 | 1.45699 |
|
Blacks |
1.35303 | 1.43730 |
|
Non-black/non-Hispanics |
1.58686 | 1.56996 |
|
Hispanic or Latino Males |
1.24321 | 1.22329 |
|
Hispanic or Latino Females |
1.40353 | 1.25095 |
|
Black Males |
1.19457 | 1.21378 |
|
Black Females |
1.24877 | 1.25243 |
|
Non-black/non-Hispanic Males |
1.33775 | 1.45962 |
|
Non-black/non-Hispanic Females |
1.46889 | 1.37581 |
|
Demographic Group |
Proportions | Means |
|---|---|---|
|
All Youth |
1.35848 | 1.967232 |
|
Males |
1.28523 | 1.667333 |
|
Females |
1.24536 | 1.621727 |
|
Hispanics or Latinos |
1.28275 | 1.584298 |
|
Blacks |
1.19735 | 1.423025 |
|
Non-black/non-Hispanics |
1.19087 | 1.713184 |
|
Hispanic or Latino Males |
1.17744 | 1.407125 |
|
Hispanic or Latino Females |
1.13217 | 1.264911 |
|
Black Males |
1.16541 | 1.174734 |
|
Black Females |
1.13258 | 1.319091 |
|
Non-black/non-Hispanic Males |
1.13217 | 1.456022 |
|
Non-black/non-Hispanic Females |
1.09545 | 1.405347 |
|
Demographic Group |
Proportions | Means |
|---|---|---|
|
All Youth |
1.38301 | 1.96469 |
|
Males |
1.30836 | 1.66433 |
|
Females |
1.28311 | 1.60000 |
|
Hispanics or Latinos |
1.21917 | 1.52807 |
|
Blacks |
1.19164 | 1.40890 |
|
Non-black/non-Hispanics |
1.17937 | 1.67481 |
|
Hispanic or Latino Males |
1.19248 | 1.37659 |
|
Hispanic or Latino Females |
1.13418 | 1.25100 |
|
Black Males |
1.14336 | 1.12694 |
|
Black Females |
1.12088 | 1.31529 |
|
Non-black/non-Hispanic Males |
1.18195 | 1.43353 |
|
Non-black/non-Hispanic Females |
1.11028 | 1.37133 |
|
Demographic Group |
Proportions | Means |
|---|---|---|
|
All Youth |
1.36423 | 1.90919 |
|
Males |
1.26007 | 1.61864 |
|
Females |
1.21244 | 1.58588 |
|
Hispanics or Latinos |
1.24544 | 1.48492 |
|
Blacks |
1.19954 | 1.42127 |
|
Non-black/non-Hispanics |
1.20052 | 1.62327 |
|
Hispanic or Latino Males |
1.19722 | 1.31909 |
|
Hispanic or Latino Females |
1.09240 | 1.22474 |
|
Black Males |
1.20277 | 1.18322 |
|
Black Females |
1.08282 | 1.34907 |
|
Non-black/non-Hispanic Males |
1.12750 | 1.39462 |
|
Non-black/non-Hispanic Females |
1.13908 | 1.34907 |
|
Demographic Group |
Proportions | Means |
|---|---|---|
|
All Youth |
1.34578 | 1.82757 |
|
Males |
1.29701 | 1.58430 |
|
Females |
1.18181 | 1.52807 |
|
Hispanics or Latinos |
1.24097 | 1.47986 |
|
Blacks |
1.20692 | 1.35647 |
|
Non-black/non-Hispanics |
1.15085 | 1.56844 |
|
Hispanic or Latino Males |
1.12450 | 1.28841 |
|
Hispanic or Latino Females |
1.09479 | 1.21861 |
|
Black Males |
1.20830 | 1.12694 |
|
Black Females |
1.18743 | 1.33604 |
|
Non-black/non-Hispanic Males |
1.20468 | 1.37659 |
|
Non-black/non-Hispanic Females |
1.06829 | 1.30958 |
Important information: Deft tables for rounds 21 through the current public release
Users are cautioned that the figures in the proportion column for the last six categories are becoming much less relevant over time. The proportion DEFT column is based on education, training, marriage, and employment variables. Over time categories, such as black females, have only a few respondents in school or training, which causes the Deft factors to change from survey to survey. Broader categories, like "All Youth," "Males," and "Females" are more accurate to use.
|
Demographic Group |
Proportions | Means |
|---|---|---|
|
All Youth |
1.38789 | 1.83712 |
|
Males |
1.27377 | 1.55563 |
|
Females |
1.23592 | 1.55081 |
|
Hispanics or Latinos |
1.30336 | 1.46969 |
|
Blacks |
1.14782 | 1.35831 |
|
Non-black/non-Hispanics |
1.18163 | 1.57003 |
|
Hispanic or Latino Males |
1.27083 | 1.31149 |
|
Hispanic or Latino Females |
1.12750 | 1.19164 |
|
Black Males |
1.14455 | 1.10454 |
|
Black Females |
1.02896 | 1.37113 |
|
Non-black/non-Hispanic Males |
1.09373 | 1.35647 |
|
Non-black/non-Hispanic Females |
1.08224 | 1.32098 |
|
Demographic Group |
Proportions | Means |
|---|---|---|
|
All Youth |
1.35881 | 1.81246 |
|
Males |
1.23472 | 1.55563 |
|
Females |
1.25553 | 1.52315 |
|
Hispanics or Latinos |
1.13710 | 1.48661 |
|
Blacks |
1.15994 | 1.33041 |
|
Non-black/non-Hispanics |
1.14455 | 1.53460 |
|
Hispanic or Latino Males |
1.15195 | 1.31719 |
|
Hispanic or Latino Females |
1.00995 | 1.23085 |
|
Black Males |
1.15247 | 1.09772 |
|
Black Females |
1.11221 | 1.35647 |
|
Non-black/non-Hispanic Males |
1.09636 | 1.32288 |
|
Non-black/non-Hispanic Females |
1.08082 | 1.30192 |
|
Demographic Group |
Proportions | Means |
|---|---|---|
|
All Youth |
1.31106 | 1.83712 |
|
Males |
1.25599 | 1.60468 |
|
Females |
1.22474 | 1.52315 |
|
Hispanics or Latinos |
1.13235 | 1.43353 |
|
Blacks |
1.16726 | 1.38203 |
|
Non-black/non-Hispanics |
1.10855 | 1.56365 |
|
Hispanic or Latino Males |
1.14837 | 1.27083 |
|
Hispanic or Latino Females |
1.03870 | 1.18322 |
|
Black Males |
1.14182 | 1.12916 |
|
Black Females |
1.11467 | 1.34907 |
|
Non-black/non-Hispanic Males |
1.09030 | 1.38564 |
|
Non-black/non-Hispanic Females |
1.09829 | 1.28841 |
|
Demographic Group |
Proportions | Means |
|---|---|---|
|
All Youth |
1.34024 | 1.80278 |
|
Males |
1.26293 | 1.58745 |
|
Females |
1.23288 | 1.48829 |
|
Hispanics or Latinos |
1.19284 | 1.46116 |
|
Blacks |
1.21295 | 1.36015 |
|
Non-black/non-Hispanics |
1.12639 | 1.54434 |
|
Hispanic or Latino Males |
1.19284 | 1.28452 |
|
Hispanic or Latino Females |
1.11867 | 1.20208 |
|
Black Males |
1.16458 | 1.10905 |
|
Black Females |
1.13137 | 1.34907 |
|
Non-black/non-Hispanic Males |
1.07877 | 1.37659 |
|
Non-black/non-Hispanic Females |
1.03983 | 1.26886 |
|
Demographic Group |
Proportions | Means |
|---|---|---|
|
All Youth |
1.34604 | 1.77682 |
|
Males |
1.26681 | 1.55921 |
|
Females |
1.24255 | 1.48757 |
|
Hispanics or Latinos |
1.21171 | 1.46095 |
|
Blacks |
1.19992 | 1.35592 |
|
Non-black/non-Hispanics |
1.17951 | 1.52438 |
|
Hispanic or Latino Males |
1.16338 | 1.24213 |
|
Hispanic or Latino Females |
1.05880 | 1.20750 |
|
Black Males |
1.11229 | 1.16998 |
|
Black Females |
1.15019 | 1.32479 |
|
Non-black/non-Hispanic Males |
1.14991 | 1.36160 |
|
Non-black/non-Hispanic Females |
1.12411 | 1.25952 |
|
Demographic Group |
Proportions | Means |
|---|---|---|
|
All Youth |
1.33370 | 1.77496 |
|
Males |
1.25238 | 1.56764 |
|
Females |
1.19779 | 1.50041 |
|
Hispanics or Latinos |
1.15607 | 1.41956 |
|
Blacks |
1.13520 | 1.38628 |
|
Non-black/non-Hispanics |
1.18624 | 1.50758 |
|
Hispanic or Latino Males |
1.15649 | 1.25180 |
|
Hispanic or Latino Females |
1.06414 | 1.20324 |
|
Black Males |
1.12620 | 1.19193 |
|
Black Females |
1.00051 | 1.34394 |
|
Non-black/non-Hispanic Males |
1.15447 | 1.35138 |
|
Non-black/non-Hispanic Females |
1.18466 | 1.26346 |
|
Demographic Group |
Proportions | Means |
|---|---|---|
|
All Youth |
1.40369 | 1.73651 |
|
Males |
1.36746 | 1.53267 |
|
Females |
1.23931 | 1.47176 |
|
Hispanics or Latinos |
1.28005 | 1.44627 |
|
Blacks |
1.10852 | 1.34987 |
|
Non-black/non-Hispanics |
1.26546 | 1.47732 |
|
Hispanic or Latino Males |
1.19194 | 1.22472 |
|
Hispanic or Latino Females |
1.16081 | 1.23085 |
|
Black Males |
1.10918 | 1.15997 |
|
Black Females |
1.04381 | 1.30468 |
|
Non-black/non-Hispanic Males |
1.21767 | 1.32061 |
|
Non-black/non-Hispanic Females |
1.17469 | 1.24867 |
|
Demographic Group |
Proportions | Means |
|---|---|---|
|
All Youth |
1.36769 | 1.72280 |
|
Males |
1.29963 | 1.57090 |
|
Females |
1.18347 | 1.46229 |
|
Hispanics or Latinos |
1.23085 | 1.43839 |
|
Blacks |
1.06561 | 1.30877 |
|
Non-black/non-Hispanics |
1.21787 | 1.46098 |
|
Hispanic or Latino Males |
1.12575 | 1.25443 |
|
Hispanic or Latino Females |
1.10262 | 1.19304 |
|
Black Males |
1.05849 | 1.15098 |
|
Black Females |
0.97723 | 1.31684 |
|
Non-black/non-Hispanic Males |
1.12186 | 1.35481 |
|
Non-black/non-Hispanic Females |
1.11219 | 1.22446 |
|
Demographic Group |
Proportions | Means |
|---|---|---|
|
All Youth |
1.36387 | 1.72145 |
|
Males |
1.35466 | 1.56630 |
|
Females |
1.12285 | 1.12285 |
|
Hispanics or Latinos |
1.15142 | 1.15142 |
|
Blacks |
1.05324 | 1.28861 |
|
Non-black/non-Hispanics |
1.22780 | 1.45744 |
|
Hispanic or Latino Males |
1.00312 | 1.22750 |
|
Hispanic or Latino Females |
1.02489 | 1.21003 |
|
Black Males |
0.95852 | 1.09251 |
|
Black Females |
0.96780 | 1.34382 |
|
Non-black/non-Hispanic Males |
1.16393 | 1.36001 |
|
Non-black/non-Hispanic Females |
1.06213 |
1.19797
|
|
Demographic Group |
Proportions | Means |
|---|---|---|
|
All Youth |
1.11022 | 1.71275 |
|
Males |
1.10061 | 1.57639 |
|
Females |
0.93109 | 1.39730 |
|
Hispanics or Latinos |
1.03198 | 1.42323 |
|
Blacks |
0.94075 | 1.31054 |
|
Non-black/non-Hispanics |
0.99426 | 1.44663 |
|
Hispanic or Latino Males |
0.96821 | 1.25049 |
|
Hispanic or Latino Females |
0.93765 | 1.18866 |
|
Black Males |
0.97012 | 1.17667 |
|
Black Females |
0.82893 | 1.31188 |
|
Non-black/non-Hispanic Males |
1.01556 | 1.35862 |
|
Non-black/non-Hispanic Females |
0.84741 | 1.17163 |
Scroll right to view additional table columns or click the link at the bottom of each table to open in a new window.
| Description | All | Male | Female | Hispanic or Latino | Black | Non-black, non-Hispanic | Male Hispanic or Latino | Female Hispanic or Latino | Male Black | Female Black | Male Non-black, non-Hispanic | Female Non-black, non-Hispanic |
|---|---|---|---|---|---|---|---|---|---|---|---|---|
|
Proportion High School Dropouts |
0.00471 | 0.00627 | 0.00545 | 0.01385 | 0.00835 | 0.00527 | 0.01744 | 0.01814 | 0.01232 | 0.00928 | 0.00710 | 0.00619 |
|
Proportion Attending High School |
0.00735 | 0.00893 | 0.01006 | 0.01554 | 0.01151 | 0.00904 | 0.02176 | 0.02146 | 0.01460 | 0.01628 | 0.01085 | 0.01233 |
|
Proportion Attending College |
0.00597 | 0.00729 | 0.00778 | 0.01037 | 0.00784 | 0.00710 | 0.01230 | 0.01460 | 0.00919 | 0.01119 | 0.00862 | 0.00947 |
|
Proportion High School Grad |
0.00658 | 0.00776 | 0.00905 | 0.01277 | 0.01033 | 0.00785 | 0.01440 | 0.01957 | 0.01217 | 0.01448 | 0.00926 | 0.01094 |
|
Mean Years of School Completed |
0.02900 | 0.04000 | 0.03800 | 0.08200 | 0.05700 | 0.03400 | 0.10000 | 0.10500 | 0.06100 | 0.07400 | 0.04600 | 0.04400 |
|
Mean Years of School Expected |
0.04600 | 0.05900 | 0.04700 | 0.10800 | 0.06400 | 0.05500 | 0.12500 | 0.11700 | 0.07900 | 0.07900 | 0.07100 | 0.05500 |
|
Proportion Living in South |
0.02286 | 0.02353 | 0.02324 | 0.05641 | 0.04264 | 0.02544 | 0.04973 | 0.06060 | 0.04555 | 0.04084 | 0.02610 | 0.02601 |
|
Mean Numbers of Children Expected |
0.02400 | 0.02700 | 0.03200 | 0.05800 | 0.04600 | 0.02800 | 0.06500 | 0.07000 | 0.05600 | 0.05500 | 0.03100 | 0.03700 |
|
Proportion Married |
0.00454 | 0.00365 | 0.00686 | 0.01023 | 0.00533 | 0.00570 | 0.00923 | 0.01646 | 0.00440 | 0.00884 | 0.00448 | 0.00855 |
| Description | All | Male | Female | Hispanic or Latino | Black | Non-black, non-Hispanic | Male Hispanic or Latino | Female Hispanic or Latino | Male Black | Female Black | Male Non-black, non-Hispanic | Female Non-black, non-Hispanic |
|---|---|---|---|---|---|---|---|---|---|---|---|---|
|
Proportion Not on Active Duty |
0.001 | 0.003 | 0.001 | 0.005 | 0.004 | 0.002 | 0.009 | 0.001 | 0.007 | 0.003 | 0.003 | 0.001 |
|
Proportion High School Dropouts |
0.006 | 0.008 | 0.006 | 0.014 | 0.009 | 0.007 | 0.018 | 0.016 | 0.012 | 0.010 | 0.009 | 0.007 |
|
Proportion in High School or Less |
0.000 | 0.001 | 0.001 | 0.002 | 0.001 | 0.001 | 0.002 | 0.002 | 0.001 | 0.002 | 0.001 | 0.000 |
|
Proportion Attending College |
0.003 | 0.003 | 0.005 | 0.006 | 0.005 | 0.004 | 0.008 | 0.009 | 0.005 | 0.007 | 0.004 | 0.005 |
|
Proportion High School Grad |
0.006 | 0.007 | 0.006 | 0.015 | 0.009 | 0.007 | 0.018 | 0.016 | 0.012 | 0.010 | 0.009 | 0.007 |
|
Proportion Living in South |
0.034 | 0.034 | 0.036 | 0.052 | 0.046 | 0.039 | 0.049 | 0.059 | 0.046 | 0.048 | 0.038 | 0.041 |
|
Proportion Currently Married |
0.007 | 0.010 | 0.010 | 0.016 | 0.013 | 0.008 | 0.020 | 0.021 | 0.018 | 0.017 | 0.011 | 0.011 |
|
Proportion Employed at Present |
0.006 | 0.007 | 0.009 | 0.015 | 0.009 | 0.007 | 0.017 | 0.020 | 0.014 | 0.013 | 0.007 | 0.010 |
|
Proportion Unemployed |
0.002 | 0.003 | 0.003 | 0.006 | 0.005 | 0.003 | 0.007 | 0.009 | 0.008 | 0.008 | 0.004 | 0.004 |
|
Proportion in Labor Force |
0.005 | 0.005 | 0.008 | 0.013 | 0.008 | 0.006 | 0.015 | 0.018 | 0.012 | 0.012 | 0.006 | 0.010 |
|
Proportion Gov't Training |
0.001 | 0.001 | 0.001 | 0.003 | 0.002 | 0.001 | 0.003 | 0.003 | 0.002 | 0.004 | 0.001 | 0.001 |
|
Average Number of Children |
0.023 | 0.027 | 0.030 | 0.054 | 0.035 | 0.028 | 0.067 | 0.065 | 0.040 | 0.050 | 0.033 | 0.036 |
|
Average Highest Grade Completed |
0.060 | 0.074 | 0.063 | 0.109 | 0.065 | 0.073 | 0.137 | 0.119 | 0.074 | 0.081 | 0.091 | 0.077 |
|
Proportion Currently Enrolled |
0.003 | 0.004 | 0.005 | 0.006 | 0.005 | 0.004 | 0.008 | 0.008 | 0.005 | 0.007 | 0.004 | 0.006 |
| Description | All | Male | Female | Hispanic or Latino | Black | Non-black, non-Hispanic | Male Hispanic or Latino | Female Hispanic or Latino | Male Black | Female Black | Male Non-black, non-Hispanic | Female Non-black, non-Hispanic |
|---|---|---|---|---|---|---|---|---|---|---|---|---|
|
Proportion Not on Active Duty |
0.001 | 0.003 | 0.001 | 0.005 | 0.003 | 0.002 | 0.008 | 0.002 | 0.006 | 0.003 | 0.003 | 0.001 |
|
Proportion High School Dropouts |
0.005 | 0.007 | 0.006 | 0.014 | 0.009 | 0.006 | 0.017 | 0.016 | 0.012 | 0.010 | 0.009 | 0.007 |
|
Proportion in High School or Less |
0.000 | 0.000 | 0.001 | 0.000 | 0.001 | 0.000 | 0.000 | 0.001 | 0.001 | 0.001 | 0.000 | 0.001 |
|
Proportion Attending College |
0.003 | 0.003 | 0.005 | 0.005 | 0.005 | 0.003 | 0.005 | 0.008 | 0.005 | 0.007 | 0.004 | 0.005 |
|
Proportion High School Grad |
0.005 | 0.007 | 0.006 | 0.014 | 0.009 | 0.006 | 0.017 | 0.016 | 0.012 | 0.010 | 0.009 | 0.007 |
|
Proportion Living in South |
0.035 | 0.034 | 0.037 | 0.051 | 0.045 | 0.039 | 0.047 | 0.058 | 0.044 | 0.047 | 0.039 | 0.041 |
|
Proportion Currently Married |
0.008 | 0.010 | 0.011 | 0.015 | 0.012 | 0.008 | 0.021 | 0.021 | 0.018 | 0.016 | 0.011 | 0.010 |
|
Proportion Employed at Present |
0.006 | 0.007 | 0.009 | 0.014 | 0.009 | 0.007 | 0.017 | 0.020 | 0.012 | 0.014 | 0.008 | 0.011 |
|
Proportion Unemployed |
0.002 | 0.003 | 0.003 | 0.005 | 0.005 | 0.002 | 0.007 | 0.008 | 0.007 | 0.007 | 0.003 | 0.003 |
|
Proportion in Labor Force |
0.005 | 0.006 | 0.009 | 0.013 | 0.008 | 0.006 | 0.016 | 0.019 | 0.011 | 0.011 | 0.006 | 0.011 |
|
Proportion Gov't Training |
0.001 | 0.001 | 0.001 | 0.002 | 0.002 | 0.001 | 0.003 | 0.004 | 0.003 | 0.004 | 0.001 | 0.001 |
|
Average Number of Children |
0.024 | 0.028 | 0.030 | 0.050 | 0.036 | 0.028 | 0.061 | 0.065 | 0.042 | 0.050 | 0.033 | 0.035 |
|
Average Highest Grade Completed |
0.061 | 0.077 | 0.063 | 0.114 | 0.066 | 0.073 | 0.147 | 0.121 | 0.074 | 0.082 | 0.09. | 0.074 |
|
Proportion Currently Enrolled |
0.003 | 0.003 | 0.004 | 0.005 | 0.005 | 0.003 | 0.005 | 0.008 | 0.005 | 0.007 | 0.004 | 0.005 |
| Description | All | Male | Female | Hispanic or Latino | Black | Non-black, non-Hispanic | Male Hispanic or Latino | Female Hispanic or Latino | Male Black | Female Black | Male Non-black, non-Hispanic | Female Non-black, non-Hispanic |
|---|---|---|---|---|---|---|---|---|---|---|---|---|
|
Proportion Not on Active Duty |
0.001 | 0.002 | 0.000 | 0.003 | 0.003 | 0.001 | 0.006 | 0.001 | 0.005 | 0.002 | 0.003 | 0.000 |
|
Proportion High School Dropouts |
0.005 | 0.007 | 0.006 | 0.014 | 0.009 | 0.006 | 0.017 | 0.015 | 0.013 | 0.010 | 0.009 | 0.006 |
|
Proportion in High School or Less |
0.000 | 0.000 | 0.000 | 0.001 | 0.001 | 0.000 | 0.001 | 0.002 | 0.002 | 0.000 | 0.000 | 0.000 |
|
Proportion Attending College |
0.003 | 0.003 | 0.004 | 0.006 | 0.004 | 0.003 | 0.008 | 0.009 | 0.004 | 0.007 | 0.003 | 0.005 |
|
Proportion High School Grad |
0.005 | 0.007 | 0.006 | 0.014 | 0.009 | 0.006 | 0.017 | 0.015 | 0.013 | 0.010 | 0.009 | 0.006 |
|
Proportion Living in South |
0.035 | 0.034 | 0.037 | 0.052 | 0.043 | 0.039 | 0.049 | 0.059 | 0.044 | 0.046 | 0.038 | 0.041 |
|
Proportion Currently Married |
0.008 | 0.010 | 0.010 | 0.014 | 0.012 | 0.008 | 0.022 | 0.021 | 0.018 | 0.015 | 0.011 | 0.010 |
|
Proportion Employed at Present |
0.006 | 0.006 | 0.009 | 0.012 | 0.009 | 0.007 | 0.014 | 0.018 | 0.014 | 0.012 | 0.007 | 0.010 |
|
Proportion Gov't Training |
0.001 | 0.001 | 0.001 | 0.003 | 0.002 | 0.001 | 0.003 | 0.004 | 0.003 | 0.003 | 0.001 | 0.001 |
|
Average Number of Children |
0.024 | 0.029 | 0.030 | 0.048 | 0.037 | 0.027 | 0.061 | 0.064 | 0.046 | 0.051 | 0.034 | 0.035 |
|
Average Highest Grade Completed |
0.061 | 0.076 | 0.065 | 0.114 | 0.069 | 0.074 | 0.146 | 0.118 | 0.078 | 0.089 | 0.092 | 0.078 |
|
Proportion Currently Enrolled |
0.003 | 0.003 | 0.004 | 0.006 | 0.004 | 0.003 | 0.008 | 0.009 | 0.005 | 0.007 | 0.003 | 0.005 |
R19 table note: Users are cautioned that by round 17 cohort changes have made some categories much less relevant. In particular, the extremely small subsample sizes for "Proportion government training participant" and "Proportion in high school or less" make these categories statistically suspect. They have been kept in the table for historical continuity.
| Description | All | Male | Female | Hispanic or Latino | Black | Non-black, non-Hispanic | Male Hispanic or Latino | Female Hispanic or Latino | Male Black | Female Black | Male Non-black, non-Hispanic | Female Non-black, non-Hispanic |
|---|---|---|---|---|---|---|---|---|---|---|---|---|
|
Proportion Not on Active Duty |
0.001 | 0.002 | 0.000 | 0.002 | 0.002 | 0.001 | 0.004 | 0.000 | 0.004 | 0.002 | 0.003 | 0.000 |
|
Proportion High School Dropouts |
0.005 | 0.007 | 0.005 | 0.015 | 0.008 | 0.006 | 0.018 | 0.016 | 0.011 | 0.010 | 0.009 | 0.006 |
|
Proportion in High School or Less |
0.000 | 0.000 | 0.000 | 0.000 | 0.001 | 0.000 | 0.000 | 0.000 | 0.001 | 0.001 | 0.001 | 0.000 |
|
Proportion Attending College |
0.002 | 0.003 | 0.004 | 0.004 | 0.004 | 0.002 | 0.005 | 0.006 | 0.005 | 0.006 | 0.003 | 0.004 |
|
Proportion High School Grad |
0.005 | 0.007 | 0.005 | 0.015 | 0.008 | 0.006 | 0.018 | 0.016 | 0.011 | 0.010 | 0.009 | 0.006 |
|
Proportion Living in South |
0.035 | 0.034 | 0.036 | 0.053 | 0.042 | 0.039 | 0.050 | 0.060 | 0.043 | 0.045 | 0.039 | 0.041 |
|
Proportion Currently Married |
0.009 | 0.010 | 0.011 | 0.015 | 0.013 | 0.009 | 0.023 | 0.022 | 0.018 | 0.015 | 0.011 | 0.012 |
|
Proportion Employed at Present |
0.007 | 0.007 | 0.009 | 0.012 | 0.011 | 0.008 | 0.016 | 0.015 | 0.016 | 0.014 | 0.008 | 0.011 |
|
Proportion Gov't Training |
0.002 | 0.002 | 0.002 | 0.004 | 0.004 | 0.002 | 0.006 | 0.006 | 0.006 | 0.006 | 0.002 | 0.002 |
|
Average Number of Children |
0.023 | 0.028 | 0.028 | 0.051 | 0.037 | 0.026 | 0.062 | 0.067 | 0.048 | 0.053 | 0.034 | 0.034 |
|
Average Highest Grade Completed |
0.061 | 0.077 | 0.065 | 0.120 | 0.066 | 0.074 | 0.150 | 0.125 | 0.073 | 0.091 | 0.094 | 0.078 |
|
Proportion Currently Enrolled |
0.002 | 0.003 | 0.003 | 0.004 | 0.004 | 0.002 | 0.005 | 0.006 | 0.005 | 0.006 | 0.003 | 0.004 |
R20 table note: Users are cautioned that by round 17 cohort changes have made some categories much less relevant. In particular, the extremely small sample sizes for "Proportion government training participant" and "Proportion in high school or less: make these categories statistically suspect. They have been kept in the table for historical continuity.
| Description | All | Male | Female | Hispanic or Latino | Black | Non-black, non-Hispanic | Male Hispanic or Latino | Female Hispanic or Latino | Male Black | Female Black | Male Non-black, non-Hispanic | Female Non-black, non-Hispanic |
|---|---|---|---|---|---|---|---|---|---|---|---|---|
|
Proportion Not on Active Duty |
0.001 | 0.002 | 0.000 | 0.002 | 0.002 | 0.001 | 0.004 | 0.001 | 0.003 | 0.002 | 0.002 | 0.000 |
|
Proportion High School Dropouts |
0.005 | 0.007 | 0.005 | 0.014 | 0.009 | 0.006 | 0.019 | 0.015 | 0.013 | 0.010 | 0.009 | 0.006 |
|
Proportion in High School or Less |
0.000 | 0.000 | 0.000 | 0.000 | 0.000 | 0.000 | 0.000 | 0.000 | 0.000 | 0.000 | 0.000 | 0.000 |
|
Proportion Attending College |
0.002 | 0.002 | 0.003 | 0.006 | 0.003 | 0.003 | 0.006 | 0.009 | 0.004 | 0.006 | 0.002 | 0.004 |
|
Proportion High School Grad |
0.005 | 0.007 | 0.005 | 0.014 | 0.009 | 0.006 | 0.019 | 0.015 | 0.012 | 0.010 | 0.009 | 0.006 |
|
Proportion Living in South |
0.034 | 0.034 | 0.036 | 0.053 | 0.044 | 0.039 | 0.051 | 0.059 | 0.044 | 0.045 | 0.039 | 0.041 |
|
Proportion Currently Married |
0.008 | 0.010 | 0.011 | 0.014 | 0.012 | 0.008 | 0.021 | 0.020 | 0.018 | 0.014 | 0.010 | 0.012 |
|
Proportion Employed at Present |
0.007 | 0.007 | 0.010 | 0.014 | 0.009 | 0.008 | 0.018 | 0.018 | 0.012 | 0.013 | 0.008 | 0.012 |
|
Proportion Gov't Training |
0.001 | 0.002 | 0.002 | 0.003 | 0.003 | 0.001 | 0.003 | 0.006 | 0.004 | 0.003 | 0.002 | 0.002 |
|
Average Number of Children |
0.024 | 0.029 | 0.031 | 0.053 | 0.037 | 0.028 | 0.069 | 0.065 | 0.049 | 0.051 | 0.035 | 0.036 |
|
Average Highest Grade Completed |
0.061 | 0.076 | 0.065 | 0.115 | 0.069 | 0.074 | 0.149 | 0.119 | 0.074 | 0.096 | 0.093 | 0.077 |
|
Proportion Currently Enrolled |
0.002 | 0.002 | 0.003 | 0.006 | 0.003 | 0.003 | 0.006 | 0.009 | 0.004 | 0.006 | 0.002 | 0.004 |
R21 table note: Users are cautioned that cohort changes over time have made some categories much less relevant. In particular, the extremely small sample sizes for education related variables such as "Proportion in high school or less," "Proportion government training participant," "Proportion currently enrolled," and "Proportion attending college" make these categories statistically suspect. They have been kept in the table for historical continuity.
| Description | All | Male | Female | Hispanic or Latino | Black | Non-black, non-Hispanic | Male Hispanic or Latino | Female Hispanic or Latino | Male Black | Female Black | Male Non-black, non-Hispanic | Female Non-black, non-Hispanic |
|---|---|---|---|---|---|---|---|---|---|---|---|---|
|
Proportion Not on Active Duty |
0.001 | 0.001 | 0.000 | 0.001 | 0.001 | 0.001 | 0.002 | 0.001 | 0.003 | 0.001 | 0.002 | 0.000 |
|
Proportion High School Dropouts |
0.005 | 0.007 | 0.005 | 0.014 | 0.008 | 0.005 | 0.018 | 0.016 | 0.012 | 0.009 | 0.008 | 0.006 |
|
Proportion in High School or Less |
0.000 | 0.000 | 0.000 | 0.000 | 0.000 | 0.000 | 0.000 | 0.000 | 0.000 | 0.000 | 0.000 | 0.000 |
|
Proportion Attending College |
0.002 | 0.002 | 0.003 | 0.003 | 0.004 | 0.002 | 0.003 | 0.005 | 0.005 | 0.006 | 0.002 | 0.004 |
|
Proportion High School Grad |
0.005 | 0.007 | 0.005 | 0.014 | 0.008 | 0.005 | 0.018 | 0.016 | 0.012 | 0.009 | 0.008 | 0.006 |
|
Proportion Living in South |
0.034 | 0.034 | 0.036 | 0.052 | 0.043 | 0.039 | 0.048 | 0.059 | 0.043 | 0.046 | 0.039 | 0.041 |
|
Proportion Currently Married |
0.009 | 0.010 | 0.012 | 0.014 | 0.012 | 0.009 | 0.022 | 0.018 | 0.016 | 0.015 | 0.011 | 0.012 |
|
Proportion Employed at Present |
0.007 | 0.007 | 0.010 | 0.014 | 0.010 | 0.008 | 0.020 | 0.017 | 0.014 | 0.015 | 0.008 | 0.012 |
|
Proportion Gov't Training |
0.001 | 0.002 | 0.002 | 0.002 | 0.003 | 0.001 | 0.002 | 0.004 | 0.004 | 0.005 | 0.002 | 0.002 |
|
Average Number of Children |
0.023 | 0.029 | 0.030 | 0.055 | 0.037 | 0.027 | 0.069 | 0.068 | 0.048 | 0.052 | 0.034 | 0.035 |
|
Average Highest Grade Completed |
0.061 | 0.076 | 0.065 | 0.114 | 0.067 | 0.074 | 0.145 | 0.126 | 0.072 | 0.096 | 0.093 | 0.078 |
|
Proportion Currently Enrolled |
0.002 | 0.002 | 0.003 | 0.003 | 0.004 | 0.002 | 0.003 | 0.005 | 0.005 | 0.006 | 0.002 | 0.004 |
R22 table note: Users are cautioned that cohort changes over time have made some categories much less relevant. In particular, the extremely small sample sizes for education related variables such as "Proportion in high school or less," "Proportion government training participant," "Proportion currently enrolled," and "Proportion attending college" make these categories statistically suspect. They have been kept in the table for historical continuity.
| Description | All | Male | Female | Hispanic or Latino | Black | Non-black, non-Hispanic | Male Hispanic or Latino | Female Hispanic or Latino | Male Black | Female Black | Male Non-black, non-Hispanic | Female Non-black, non-Hispanic |
|---|---|---|---|---|---|---|---|---|---|---|---|---|
|
Proportion Not on Active Duty |
0.001 | 0.001 | 0.000 | 0.001 | 0.001 | 0.001 | 0.001 | 0.001 | 0.002 | 0.001 | 0.001 | 0.000 |
|
Proportion High School Dropouts |
0.005 | 0.007 | 0.005 | 0.013 | 0.008 | 0.005 | 0.018 | 0.015 | 0.011 | 0.009 | 0.008 | 0.006 |
|
Proportion in High School or Less |
0.000 | 0.000 | 0.000 | 0.001 | 0.000 | 0.000 | 0.000 | 0.002 | 0.000 | 0.000 | 0.000 | 0.001 |
|
Proportion Attending College |
0.002 | 0.002 | 0.003 | 0.004 | 0.003 | 0.002 | 0.005 | 0.005 | 0.005 | 0.006 | 0.002 | 0.004 |
|
Proportion High School Grad |
0.005 | 0.007 | 0.005 | 0.013 | 0.008 | 0.005 | 0.018 | 0.015 | 0.011 | 0.009 | 0.008 | 0.006 |
|
Proportion Living in South |
0.032 | 0.031 | 0.034 | 0.050 | 0.043 | 0.035 | 0.046 | 0.058 | 0.042 | 0.046 | 0.034 | 0.038 |
|
Proportion Currently Married |
0.009 | 0.010 | 0.011 | 0.015 | 0.012 | 0.008 | 0.022 | 0.020 | 0.017 | 0.015 | 0.011 | 0.012 |
|
Proportion Employed at Present |
0.008 | 0.010 | 0.013 | 0.011 | 0.008 | 0.018 | 0.017 | 0.015 | 0.014 | 0.008 | 0.012 | |
|
Proportion Gov't Training |
0.001 | 0.002 | 0.002 | 0.002 | 0.003 | 0.001 | 0.003 | 0.004 | 0.003 | 0.004 | 0.002 | 0.002 |
|
Average Number of Children |
0.023 | 0.030 | 0.030 | 0.054 | 0.038 | 0.027 | 0.068 | 0.067 | 0.049 | 0.052 | 0.036 | 0.035 |
|
Average Highest Grade Completed |
0.062 | 0.078 | 0.066 | 0.109 | 0.070 | 0.075 | 0.141 | 0.117 | 0.076 | 0.094 | 0.096 | 0.079 |
|
Proportion Currently Enrolled |
0.002 | 0.002 | 0.003 | 0.004 | 0.004 | 0.002 | 0.006 | 0.006 | 0.005 | 0.007 | 0.002 | 0.004 |
R23 table note: Users are cautioned that cohort changes over time have made some categories much less relevant. In particular, the extremely small sample sizes for education related variables such as "Proportion in high school or less," "Proportion government training participant," "Proportion currently enrolled," and "Proportion attending college" make these categories statistically suspect. They have been kept in the table for historical continuity.
| Description | All | Male | Female | Hispanic or Latino | Black | Non-black, non-Hispanic | Male Hispanic or Latino | Female Hispanic or Latino | Male Black | Female Black | Male Non-black, non-Hispanic | Female Non-black, non-Hispanic |
|---|---|---|---|---|---|---|---|---|---|---|---|---|
|
Proportion Not on Active Duty |
0.000 | 0.001 | 0.000 | 0.000 | 0.001 | 0.000 | 0.000 | 0.000 | 0.002 | 0.001 | 0.001 | 0.000 |
|
Proportion High School Dropouts |
0.005 | 0.007 | 0.005 | 0.013 | 0.008 | 0.005 | 0.019 | 0.015 | 0.011 | 0.009 | 0.008 | 0.006 |
|
Proportion in High School or Less |
0.000 | 0.000 | 0.000 | 0.000 | 0.000 | 0.000 | 0.000 | 0.000 | 0.000 | 0.000 | 0.000 | 0.000 |
|
Proportion Attending College |
0.002 | 0.002 | 0.003 | 0.003 | 0.004 | 0.002 | 0.005 | 0.004 | 0.004 | 0.007 | 0.002 | 0.003 |
|
Proportion High School Grad |
0.005 | 0.007 | 0.005 | 0.013 | 0.008 | 0.005 | 0.019 | 0.015 | 0.011 | 0.009 | 0.008 | 0.006 |
|
Proportion Living in South |
0.034 | 0.033 | 0.037 | 0.051 | 0.042 | 0.039 | 0.047 | 0.058 | 0.042 | 0.044 | 0.038 | 0.041 |
|
Proportion Currently Married |
0.009 | 0.010 | 0.011 | 0.016 | 0.012 | 0.008 | 0.021 | 0.023 | 0.017 | 0.016 | 0.010 | 0.012 |
|
Proportion Employed at Present |
0.008 | 0.009 | 0.011 | 0.014 | 0.011 | 0.009 | 0.019 | 0.020 | 0.017 | 0.014 | 0.011 | 0.013 |
|
Proportion Gov't Training |
0.001 | 0.002 | 0.002 | 0.003 | 0.003 | 0.002 | 0.004 | 0.005 | 0.004 | 0.004 | 0.002 | 0.002 |
|
Average Number of Children |
0.024 | 0.030 | 0.030 | 0.057 | 0.037 | 0.027 | 0.072 | 0.068 | 0.049 | 0.053 | 0.036 | 0.035 |
|
Average Highest Grade Completed |
0.062 | 0.079 | 0.064 | 0.112 | 0.072 | 0.075 | 0.140 | 0.125 | 0.077 | 0.098 | 0.096 | 0.077 |
|
Proportion Currently Enrolled |
0.002 | 0.002 | 0.003 | 0.003 | 0.004 | 0.002 | 0.005 | 0.004 | 0.004 | 0.007 | 0.002 | 0.004 |
R24 table note: Users are cautioned that cohort changes over time have made some categories much less relevant. In particular, the extremely small sample sizes for education related variables such as "Proportion in high school or less," "Proportion government training participant," "Proportion currently enrolled," and "Proportion attending college" make these categories statistically suspect. They have been kept in the table for historical continuity.
| Description | All | Male | Female | Hispanic or Latino | Black | Non-black, non-Hispanic | Male Hispanic or Latino | Female Hispanic or Latino | Male Black | Female Black | Male Non-black, non-Hispanic | Female Non-black, non-Hispanic |
|---|---|---|---|---|---|---|---|---|---|---|---|---|
|
Proportion Not on Active Duty |
0.000 | 0.000 | 0.000 | 0.000 | 0.001 | 0.000 | 0.000 | 0.000 | 0.000 | 0.001 | 0.000 | 0.000 |
|
Proportion High School Dropouts |
0.007 | 0.005 | 0.014 | 0.009 | 0.005 | 0.020 | 0.015 | 0.012 | 0.009 | 0.009 | 0.006 | |
|
Proportion in High School or Less |
NA | NA | NA | NA | NA | NA | NA | NA | NA | NA | NA | NA |
|
Proportion Attending College |
0.002 | 0.003 | 0.003 | 0.004 | 0.005 | 0.003 | 0.003 | 0.007 | 0.004 | 0.008 | 0.004 | 0.004 |
|
Proportion High School Grad |
0.005 | 0.007 | 0.005 | 0.014 | 0.008 | 0.006 | 0.020 | 0.015 | 0.012 | 0.008 | 0.008 | 0.006 |
|
Proportion Living in South |
0.034 | 0.034 | 0.036 | 0.055 | 0.043 | 0.039 | 0.055 | 0.064 | 0.044 | 0.046 | 0.039 | 0.041 |
|
Proportion Currently Married |
0.009 | 0.011 | 0.011 | 0.016 | 0.012 | 0.009 | 0.022 | 0.022 | 0.016 | 0.015 | 0.012 | 0.012 |
|
Proportion Employed at Present |
0.008 | 0.010 | 0.011 | 0.015 | 0.011 | 0.009 | 0.020 | 0.018 | 0.016 | 0.015 | 0.010 | 0.013 |
|
Proportion Gov't Training |
0.001 | 0.002 | 0.002 | 0.004 | 0.003 | 0.001 | 0.004 | 0.005 | 0.004 | 0.005 | 0.002 | 0.002 |
|
Average Number of Children |
0.024 | 0.030 | 0.031 | 0.058 | 0.038 | 0.027 | 0.068 | 0.069 | 0.053 | 0.052 | 0.036 | 0.036 |
|
Average Highest Grade Completed |
0.062 | 0.080 | 0.065 | 0.114 | 0.073 | 0.076 | 0.139 | 0.126 | 0.084 | 0.098 | 0.098 | 0.078 |
|
Proportion Currently Enrolled |
0.002 | 0.003 | 0.004 | 0.004 | 0.005 | 0.003 | 0.003 | 0.007 | 0.004 | 0.008 | 0.004 | 0.004 |
R25 table note: Users are cautioned that cohort changes over time have made some categories much less relevant. In particular, the extremely small subsample sizes for education related variables such as "Proportion government training participant," "Proportion currently enrolled" and "Proportion attending college" make these categories statistically suspect. They have been kept in the table for historical continuity. In round 25 the variable "Proportion in high school or less" was labeled "NA" since no NLSY79 respondent was in this category.
| Description | All | Male | Female | Hispanic or Latino | Black | Non-black, non-Hispanic | Male Hispanic or Latino | Female Hispanic or Latino | Male Black | Female Black | Male Non-black, non-Hispanic | Female Non-black, non-Hispanic |
|---|---|---|---|---|---|---|---|---|---|---|---|---|
|
Proportion High School Dropouts |
0.005 | 0.007 | 0.006 | 0.014 | 0.009 | 0.006 | 0.021 | 0.016 | 0.012 | 0.010 | 0.009 | 0.007 |
|
Proportion Attending College |
0.002 | 0.003 | 0.002 | 0.004 | 0.005 | 0.004 | 0.005 | 0.008 | 0.003 | 0.007 | 0.003 | 0.004 |
|
Proportion High School Grad |
0.005 | 0.007 | 0.005 | 0.013 | 0.008 | 0.005 | 0.020 | 0.014 | 0.012 | 0.008 | 0.008 | 0.006 |
|
Proportion Living in South |
0.034 | 0.033 | 0.036 | 0.056 | 0.042 | 0.038 | 0.059 | 0.061 | 0.044 | 0.046 | 0.038 | 0.041 |
|
Proportion Currently Married |
0.009 | 0.011 | 0.012 | 0.016 | 0.012 | 0.009 | 0.022 | 0.021 | 0.017 | 0.016 | 0.012 | 0.012 |
|
Proportion Employed at Present |
0.009 | 0.011 | 0.011 | 0.014 | 0.010 | 0.010 | 0.021 | 0.019 | 0.015 | 0.013 | 0.012 | 0.013 |
|
Proportion Gov't Training |
0.001 | 0.001 | 0.002 | 0.002 | 0.003 | 0.001 | 0.003 | 0.003 | 0.004 | 0.003 | 0.001 | 0.002 |
|
Average Number of Children |
0.024 | 0.029 | 0.032 | 0.055 | 0.039 | 0.027 | 0.066 | 0.070 | 0.054 | 0.054 | 0.035 | 0.037 |
|
Average Highest Grade Completed |
0.064 | 0.084 | 0.067 | 0.114 | 0.077 | 0.078 | 0.145 | 0.129 | 0.088 | 0.100 | 0.102 | 0.080 |
|
Proportion Currently Enrolled |
0.002 | 0.002 | 0.004 | 0.005 | 0.004 | 0.003 | 0.005 | 0.008 | 0.003 | 0.007 | 0.003 | 0.004 |
R26 table note: Users are cautioned that cohort changes over time have made some categories much less relevant. In particular, the extremely small subsample sizes for education related variables such as "Proportion government training participant," "Proportion currently enrolled" and "Proportion attending college" make these categories statistically suspect. They have been kept in the table for historical continuity. In round 25, the variable "Proportion in high school or less" was removed from the table since no NLSY79 respondent was in this category. In round 26, the variable "Proportion not on active duty" was removed from the table since no NLSY79 respondent remained in this category.
| Description | All | Male | Female | Hispanic or Latino | Black | Non-black, non-Hispanic | Male Hispanic or Latino | Female Hispanic or Latino | Male Black | Female Black | Male Non-black, non-Hispanic | Female Non-black, non-Hispanic |
|---|---|---|---|---|---|---|---|---|---|---|---|---|
|
Proportion High School Dropouts |
0.0048 | 0.007 | 0.005 | 0.014 | 0.008 | 0.006 | 0.018 | 0.018 | 0.012 | 0.009 | 0.008 | 0.006 |
|
Proportion Attending College |
0.0022 | 0.003 | 0.003 | 0.004 | 0.003 | 0.003 | 0.002 | 0.009 | 0.002 | 0.006 | 0.003 | 0.004 |
|
Proportion High School Grads |
0.0046 | 0.007 | 0.005 | 0.013 | 0.008 | 0.005 | 0.018 | 0.015 | 0.012 | 0.008 | 0.008 | 0.006 |
|
Proportion Living in South |
0.0337 | 0.033 | 0.036 | 0.058 | 0.041 | 0.038 | 0.061 | 0.063 | 0.042 | 0.045 | 0.038 | 0.040 |
|
Proportion Currently Married |
0.0093 | 0.011 | 0.011 | 0.016 | 0.012 | 0.009 | 0.023 | 0.021 | 0.017 | 0.016 | 0.012 | 0.011 |
|
Proportion Employed at Present |
0.0084 | 0.010 | 0.011 | 0.015 | 0.011 | 0.009 | 0.023 | 0.018 | 0.016 | 0.015 | 0.011 | 0.013 |
|
Proportion Gov't Training |
0.0012 | 0.001 | 0.001 | 0.004 | 0.002 | 0.001 | 0.007 | 0.004 | 0.004 | 0.004 | 0.002 | 0.002 |
|
Average Number of Children |
0.0239 | 0.031 | 0.031 | 0.059 | 0.039 | 0.028 | 0.070 | 0.073 | 0.054 | 0.051 | 0.036 | 0.037 |
|
Average Highest Grade Completed |
0.0624 | 0.080 | 0.067 | 0.118 | 0.075 | 0.076 | 0.142 | 0.134 | 0.085 | 0.103 | 0.098 | 0.080 |
|
Proportion Currently Enrolled |
0.0022 | 0.003 | 0.003 | 0.004 | 0.003 | 0.003 | 0.002 | 0.009 | 0.003 | 0.006 | 0.003 | 0.004 |
R27 table note: Users are cautioned that cohort changes over time have made some categories much less relevant. In particular, the extremely small subsample sizes for education related variables such as "Proportion government training participant," "Proportion currently enrolled" and "Proportion attending college" make these categories statistically suspect. They have been kept in the table for historical continuity. In round 25 the variable "Proportion in high school or less" was removed from the table since no NLSY79 respondent was in this category. In round 26 the variable "Proportion not on active duty" was removed from the table since no NLSY79 respondent remained in this category.
| Description | All | Male | Female | Hispanic or Latino | Black | Non-black, non-Hispanic | Male Hispanic or Latino | Female Hispanic or Latino | Male Black | Female Black | Male Non-black, non-Hispanic | Female Non-black, non-Hispanic |
|---|---|---|---|---|---|---|---|---|---|---|---|---|
|
Proportion High School Dropouts |
0.0047 | 0.007 | 0.005 | 0.014 | 0.008 | 0.005 | 0.019 | 0.016 | 0.012 | 0.008 | 0.008 | 0.006 |
|
Proportion Attending College |
0.0010 | 0.001 | 0.002 | 0.002 | 0.002 | 0.001 | 0.004 | 0.003 | 0.000 | 0.004 | 0.002 | 0.002 |
|
Proportion High School Grad |
0.0047 | 0.007 | 0.005 | 0.014 | 0.008 | 0.005 | 0.019 | 0.015 | 0.012 | 0.008 | 0.008 | 0.006 |
|
Proportion Living in South |
0.0334 | 0.033 | 0.036 | 0.058 | 0.042 | 0.038 | 0.060 | 0.063 | 0.043 | 0.045 | 0.038 | 0.041 |
|
Proportion Currently Married |
0.0094 | 0.011 | 0.011 | 0.017 | 0.012 | 0.009 | 0.025 | 0.019 | 0.016 | 0.016 | 0.012 | 0.012 |
|
Proportion Employed at Present |
0.0086 | 0.010 | 0.012 | 0.016 | 0.012 | 0.010 | 0.020 | 0.022 | 0.017 | 0.016 | 0.011 | 0.014 |
|
Proportion Gov't Training |
0.0008 | 0.009 | 0.001 | 0.002 | 0.002 | 0.001 | 0.000 | 0.003 | 0.003 | 0.003 | 0.001 | 0.001 |
|
Average Number of Children |
0.0248 | 0.033 | 0.032 | 0.057 | 0.038 | 0.029 | 0.067 | 0.070 | 0.054 | 0.053 | 0.039 | 0.037 |
|
Average Highest Grade Completed |
0.0610 | 0.081 | 0.066 | 0.117 | 0.074 | 0.074 | 0.151 | 0.126 | 0.084 | 0.105 | 0.100 | 0.078 |
|
Proportion Currently Enrolled |
0.0011 | 0.001 | 0.002 | 0.003 | 0.002 | 0.001 | 0.004 | 0.004 | 0.000 | 0.004 | 0.002 | 0.002 |
R28 table note: Users are cautioned that cohort changes over time have made some categories much less relevant. In particular, the extremely small subsample sizes for education related variables such as "Proportion government training participant," "Proportion currently enrolled" and "Proportion attending college" make these categories statistically suspect. They have been kept in the table for historical continuity. In round 25 the variable "Proportion in high school or less" was removed from the table since no NLSY79 respondent was in this category. In round 26 the variable "Proportion not on active duty" was removed from the table since no NLSY79 respondent remained in this category. Beginning in round 28, the "Average highest grade completed" was the highest grade completed as of the date of most recent interview, not as of May in the year previous to survey year.
| Description | All | Male | Female | Hispanic or Latino | Black | Non-black, non-Hispanic | Male Hispanic or Latino | Female Hispanic or Latino | Male Black | Female Black | Male Non-black, non-Hispanic | Female Non-black, non-Hispanic |
|---|---|---|---|---|---|---|---|---|---|---|---|---|
|
Proportion High School Dropouts |
0.0048 | 0.007 | 0.005 | 0.014 | 0.008 | 0.006 | 0.019 | 0.015 | 0.012 | 0.008 | 0.000 | 0.006 |
|
Proportion Attending College |
0.0007 | 0.001 | 0.001 | 0.001 | 0.001 | 0.001 | 0.000 | 0.001 | 0.000 | 0.003 | 0.001 | 0.001 |
|
Proportion High School Grad |
0.0048 | 0.007 | 0.005 | 0.014 | 0.008 | 0.006 | 0.019 | 0.015 | 0.012 | 0.008 | 0.009 | 0.006 |
|
Proportion Living in South |
0.0332 | 0.034 | 0.035 | 0.058 | 0.042 | 0.038 | 0.062 | 0.062 | 0.044 | 0.044 | 0.039 | 0.040 |
|
Proportion Currently Married |
0.0100 | 0.012 | 0.012 | 0.017 | 0.012 | 0.010 | 0.025 | 0.020 | 0.017 | 0.016 | 0.013 | 0.012 |
|
Proportion Employed at Present |
0.0092 | 0.013 | 0.012 | 0.015 | 0.013 | 0.011 | 0.020 | 0.023 | 0.018 | 0.017 | 0.015 | 0.014 |
|
Proportion Gov't Training |
0.0008 | 0.001 | 0.001 | 0.003 | 0.002 | 0.001 | 0.005 | 0.003 | 0.003 | 0.002 | 0.001 | 0.001 |
|
Average Number of Children |
0.0250 | 0.034 | 0.032 | 0.055 | 0.039 | 0.029 | 0.068 | 0.071 | 0.055 | 0.057 | 0.040 | 0.037 |
|
Average Highest Grade Completed |
0.0630 | 0.085 | 0.065 | 0.121 | 0.075 | 0.076 | 0.155 | 0.130 | 0.082 | 0.108 | 0.103 | 0.076 |
|
Proportion Currently Enrolled |
0.0008 | 0.001 | 0.001 | 0.001 | 0.001 | 0.001 | 0.000 | 0.001 | 0.000 | 0.003 | 0.001 | 0.001 |
R29 table note: Users are cautioned that cohort changes over time have made some categories much less relevant. In particular, the extremely small subsample sizes for education related variables such as "Proportion government training participant," "Proportion currently enrolled" and "Proportion attending college" make these categories statistically suspect. They have been kept in the table for historical continuity. In round 25 the variable "Proportion in high school or less" was removed from the table since no NLSY79 respondent was in this category. In round 26 the variable "Proportion not on active duty" was removed from the table since no NLSY79 respondent remained in this category. Beginning in round 28, the "Average highest grade completed" was the highest grade completed as of the date of most recent interview, not as of May in the year previous to survey year.
| Description | All | Male | Female | Hispanic or Latino | Black | Non-black, non-Hispanic | Male Hispanic or Latino | Female Hispanic or Latino | Male Black | Female Black | Male Non-black, non-Hispanic | Female Non-black, non-Hispanic |
|---|---|---|---|---|---|---|---|---|---|---|---|---|
|
Proportion High School Dropouts |
0.0047 | 0.007 | 0.005 | 0.014 | 0.008 | 0.005 | 0.018 | 0.015 | 0.012 | 0.009 | 0.009 | 0.005 |
|
Proportion High School Grad |
0.0047 | 0.007 | 0.005 | 0.014 | 0.008 | 0.007 | 0.018 | 0.015 | 0.012 | 0.009 | 0.009 | 0.005 |
|
Proportion Living in South |
0.0328 | 0.034 | 0.034 | 0.062 | 0.042 | 0.037 | 0.068 | 0.065 | 0.044 | 0.044 | 0.039 | 0.038 |
|
Proportion Currently Married |
0.0100 | 0.012 | 0.011 | 0.016 | 0.013 | 0.010 | 0.025 | 0.020 | 0.018 | 0.017 | 0.013 | 0.011 |
|
Proportion Employed at Present |
0.0078 | 0.012 | 0.010 | 0.017 | 0.012 | 0.009 | 0.026 | 0.022 | 0.018 | 0.015 | 0.014 | 0.012 |
|
Proportion Gov't Training |
0.0009 | 0.002 | 0.001 | 0.002 | 0.002 | 0.001 | 0.002 | 0.003 | 0.003 | 0.003 | 0.002 | 0.001 |
|
Average Number of Children |
0.0257 | 0.034 | 0.032 | 0.059 | 0.039 | 0.030 | 0.073 | 0.073 | 0.056 | 0.053 | 0.040 | 0.037 |
|
Average Highest Grade Completed |
0.0623 | 0.087 | 0.062 | 0.118 | 0.079 | 0.074 | 0.156 | 0.122 | 0.095 | 0.110 | 0.105 | 0.072 |
R30 table note: Users are cautioned that cohort changes over time have made some categories much less relevant. In particular, the extremely small subsample sizes for education related variables such as "Proportion government training participant," "Proportion currently enrolled" and "Proportion attending college" make these categories statistically suspect. They have been kept in the table for historical continuity. In round XXV the variable "Proportion in high school or less" was removed from the table since no NLSY79 respondent was in this category. In round XXVI the variable "Proportion not on active duty" was removed from the table since no NLSY79 respondent remained in this category. Beginning in round XXVIII, the "Average highest grade completed" was the highest grade completed as of the date of most recent interview, not as of May in the year previous to survey year. No educational updates were collected in round XXX, eliminating variables depicting "Proportion attending college" and "Proportion currently enrolled."