The Codebook tab, located fifth from the left, provides access to variable information starting with the first variable in your tagset, which will always be PUBID.
The following example shows the Codebook for a created variable, Z90838.00 RS HIGHEST GRADE COMPLETED, from the NLSY97 cohort.
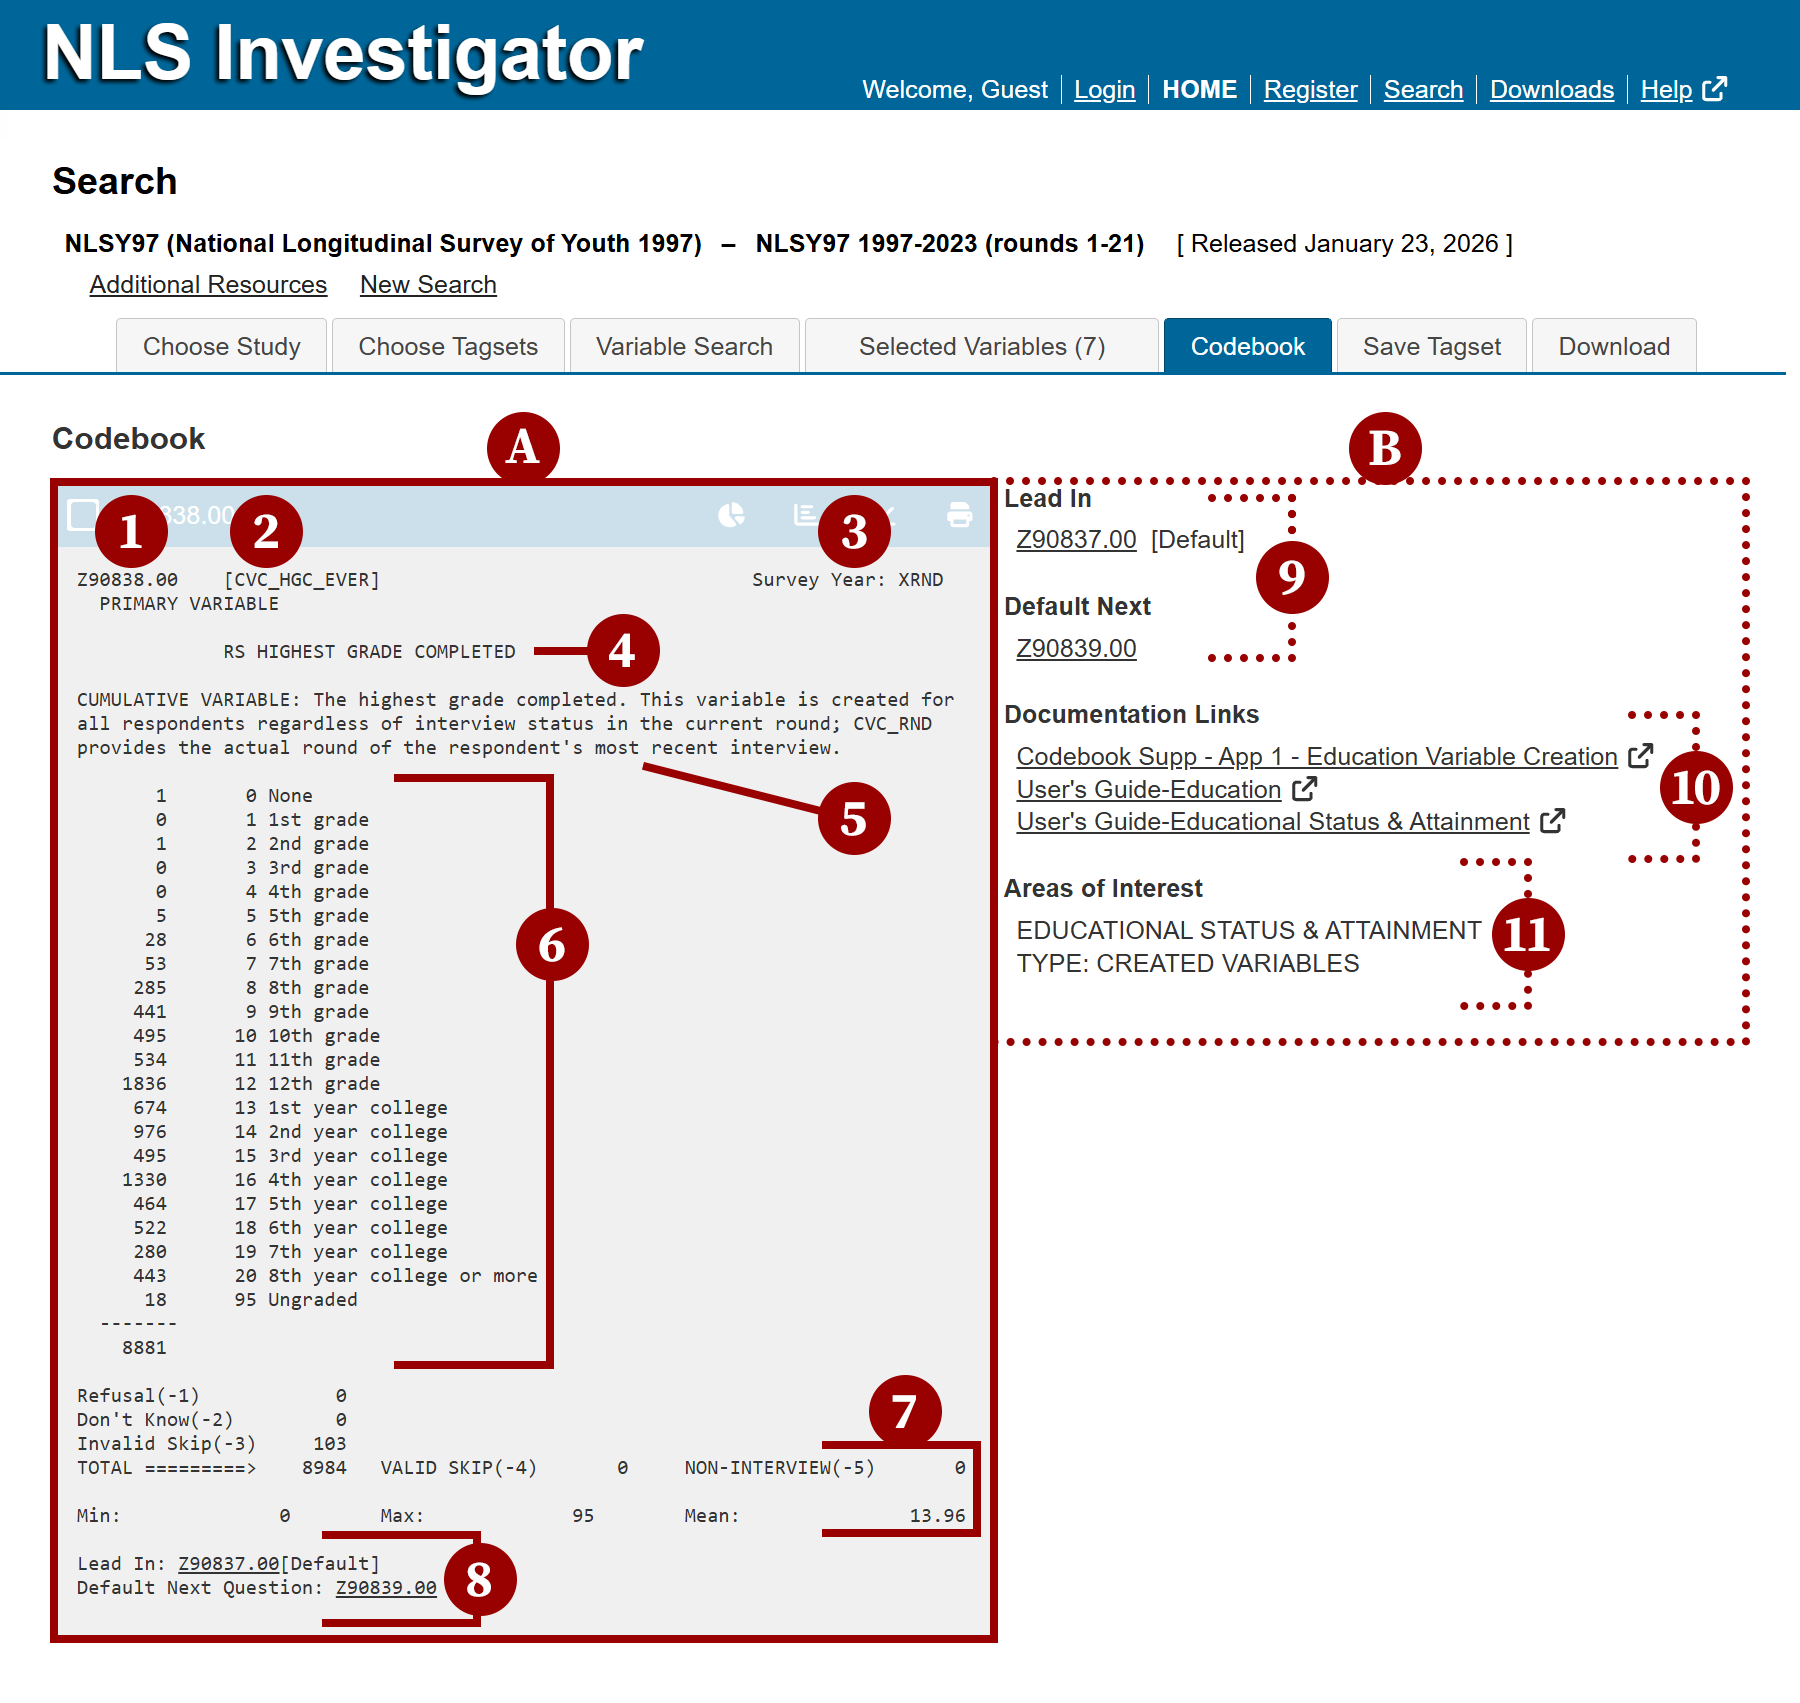
The left side of the Codebook tab (marker A) contains the following eight items:
- Reference Number (RNUM) is located at the upper left.
- Question Name (QNAME) is located to the right of the reference number.
- Survey Year is located to the right of the question name.
- Variable Title is located below the reference number, question name, and survey year.
- Question Text and Variable Description are located below the variable title.
- Frequency Distribution is located in the middle (below the question text) and displays the response categories and counts.
- Below the response categories are the Refusal (-1), Don't Know (-2), and Invalid Skip (-3) counts followed by the Total observations.
- Universe information follows the Total observations listing the Valid Skip (-4) and Non-Interview (-5) counts.
- Min, Max, and Mean values for the response categories are reported on the line below the Valid Skip and Non-Interview counts.
- Lead In and Default Next Question links appear at the bottom of marker A. The links allow you to quickly view the preceding and following questions for a selected variable as they appear in the questionnaire.
The right side of the Codebook tab (marker B) contains additional items that are not included in the Codebook Preview. Starting from top to bottom, they are:
- A second set of Lead In and Default Next question links.
- Documentation Links connect to the relevant user guide information for the variable. Additional Questionnaire Links may appear in this area dependent on the selected variable.
- Areas of Interest provides the variable categorization used in the Search Options menu bar.
Additional features
The blue bar, at the top of marker A's section, contains four icons for display graph and print features.
- Display graphs provide frequency distributions as pie, bar, and line charts.
- Print function allows you to print or save codebook items 1-8.

Next: Save Tagset
Previous: Selected Variables
Quick links: Table of Contents | Glossary of NLS Terms