NLSY97 demo
Objective
This tutorial walks you through the basic steps of selecting multiple search criteria to construct a data set using the NLSY97 cohort. It also demonstrates how to create a frequency distribution from your selected variables and how to apply a universe restrictor using the NLS Investigator's equation editor to further customize your data set.
Example: Downloading NLSY97 education variables
Preview of steps
- Step 1: Select a study
- Step 2: Add the first search criterion
- Step 3: Add a second search criterion
- Step 4: Display the search results
- Step 5: Select the variables of interest
- Step 6: Review the selected variables
- Step 7: Create a frequency distribution
- Step 8: Apply universe restrictors
- Step 9: Accessing your extract
Additional information shows the downloaded files created by the NLS Investigator and verifies the application of the universe restrictor in the data set.
Step 1: Select a study
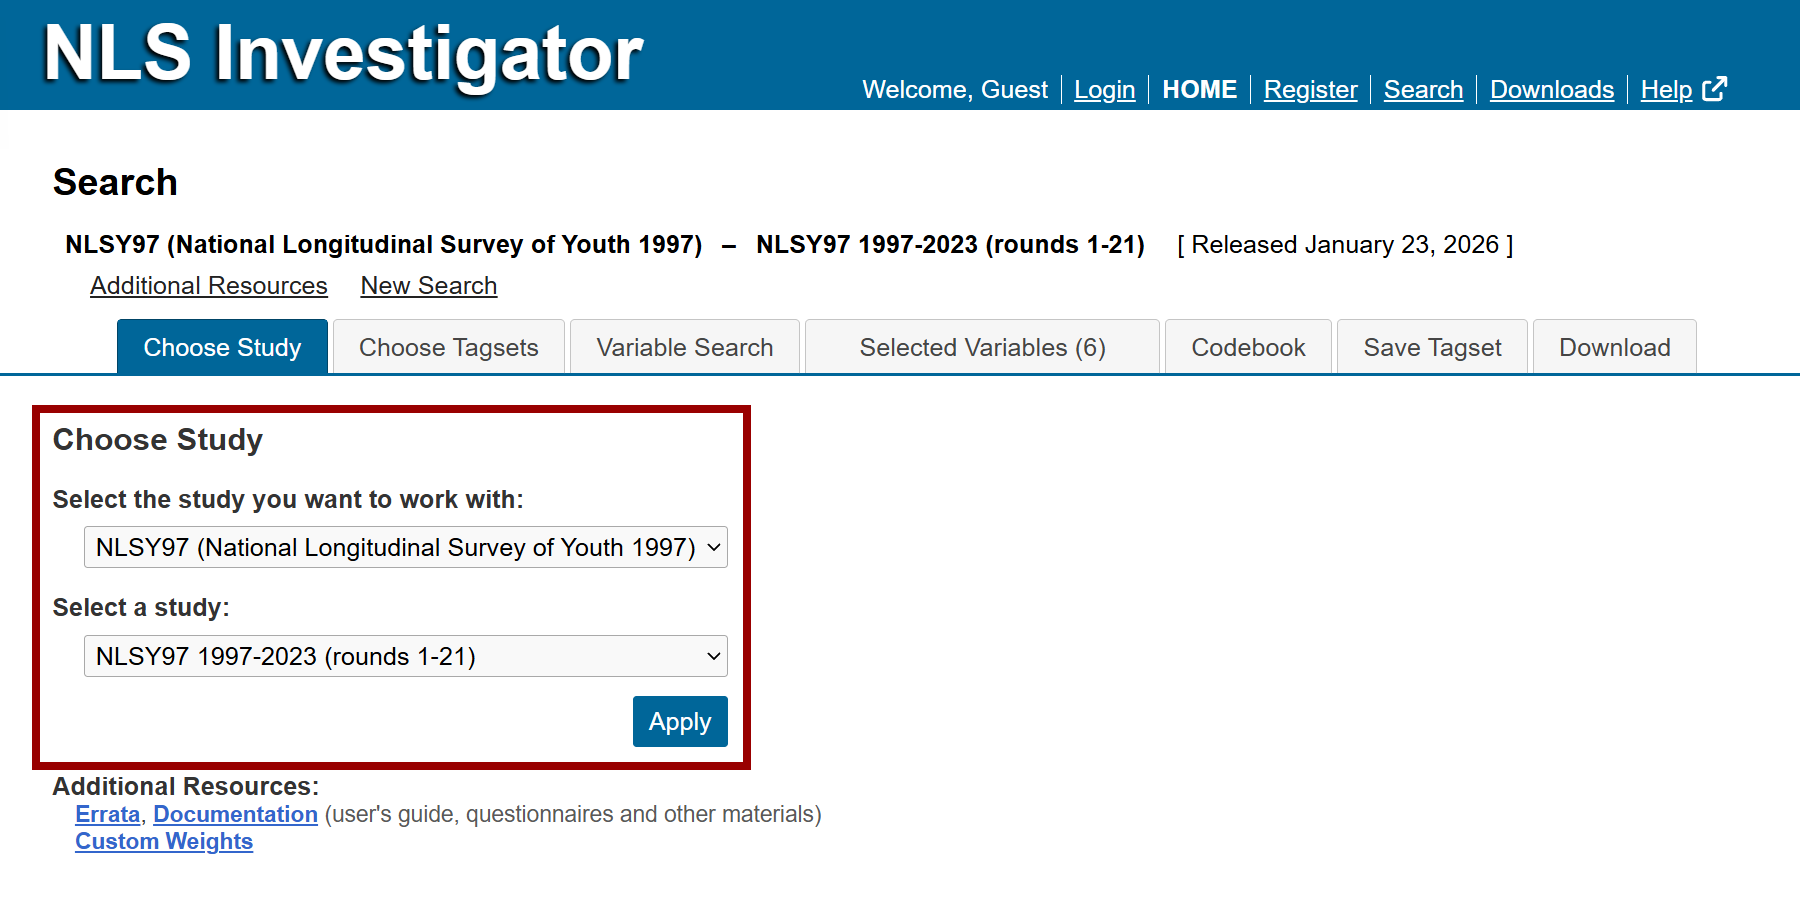
Begin by selecting the NLSY97 cohort from the drop-down menus on the Choose Study tab:
- In the first field, select: NLSY97 (National Longitudinal Survey of Youth 1997)
- In the second field, select: NLSY97 1997-2023 (rounds 1-21)
- Note: As new data are released, the survey year and the number of rounds will be updated accordingly.
Step 2: Add the first search criterion
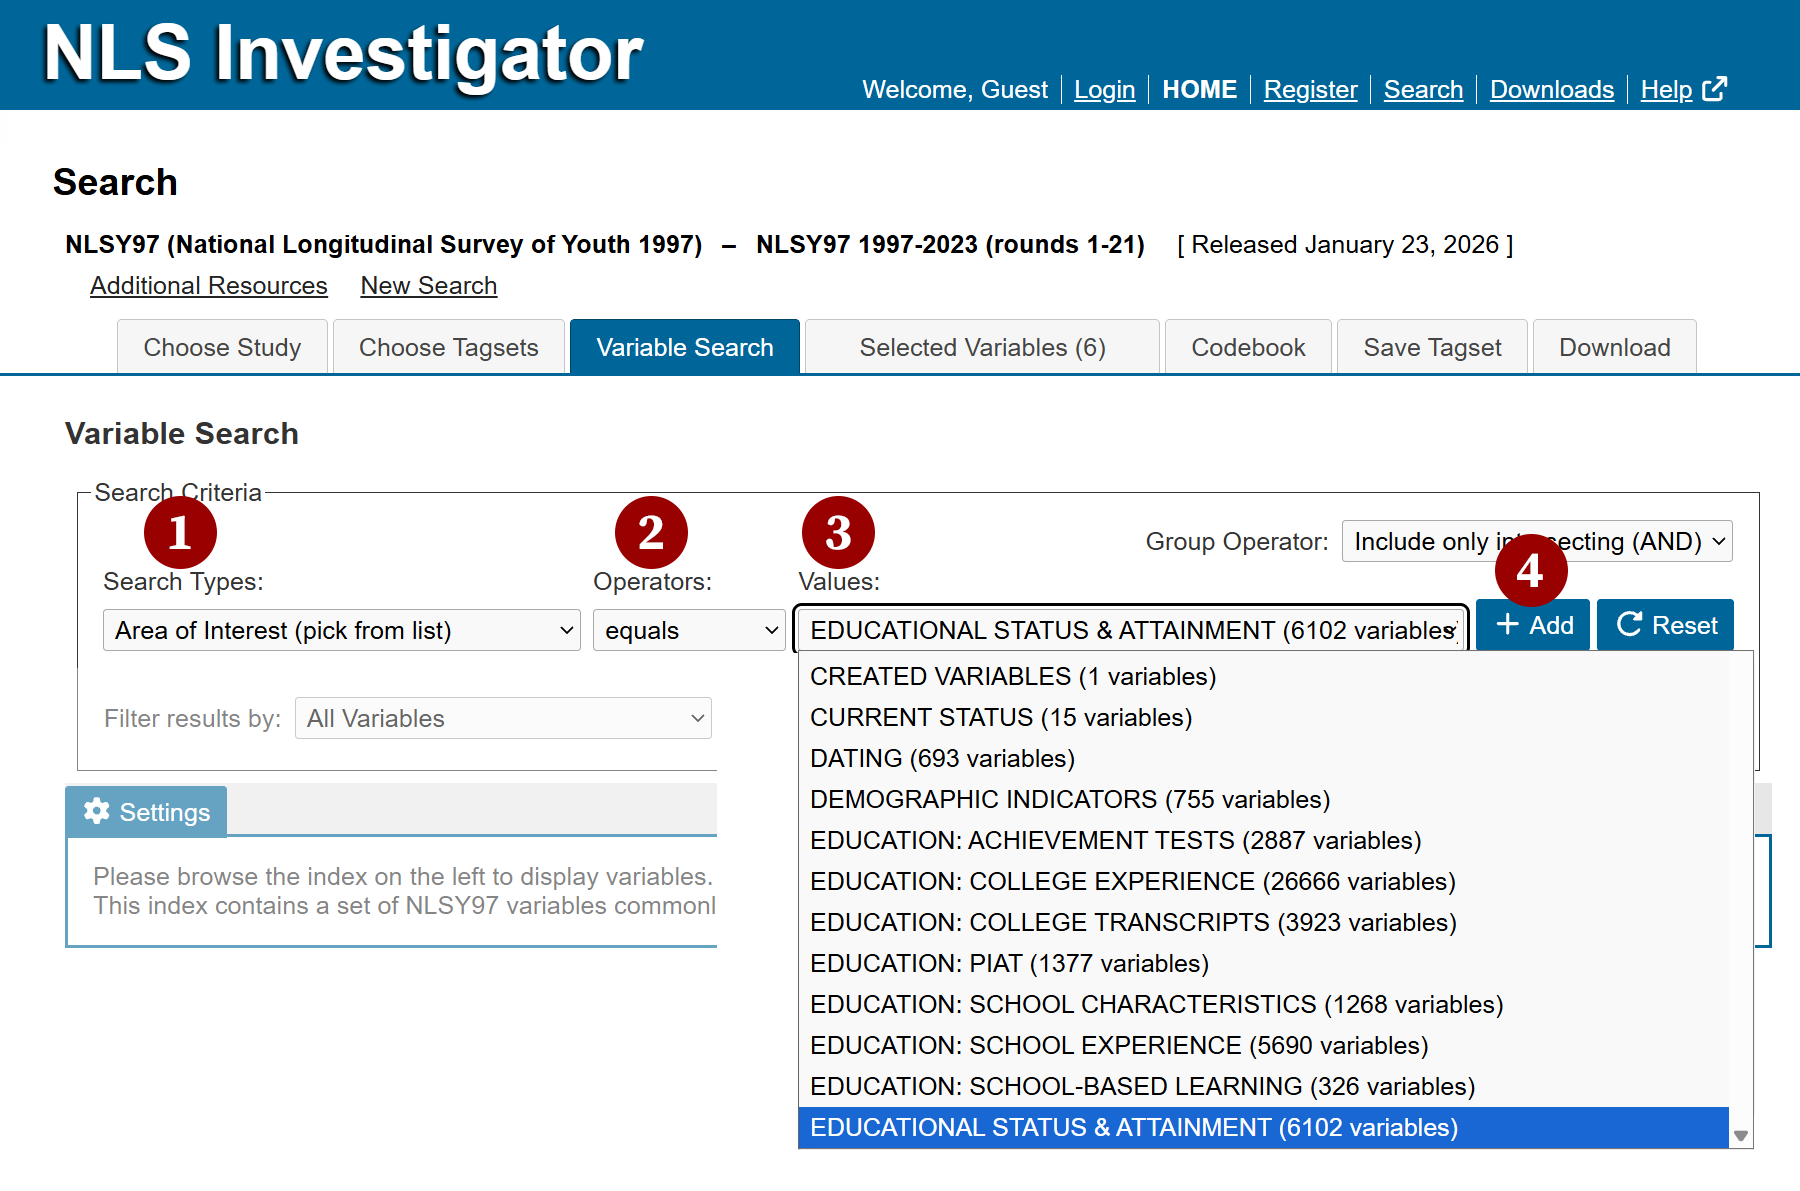
Begin by navigating to the Variable Search tab to access the criterion builder. For this demo:
- Begin at the leftmost field and choose an Area of Interest.
- Next move to the Operators field and leave the default setting as equals.
- Then in the Values field, select Educational Status & Attainment.
- Finally, click Add to add your selections to the Search Criteria.
Step 3: Add a second search criterion
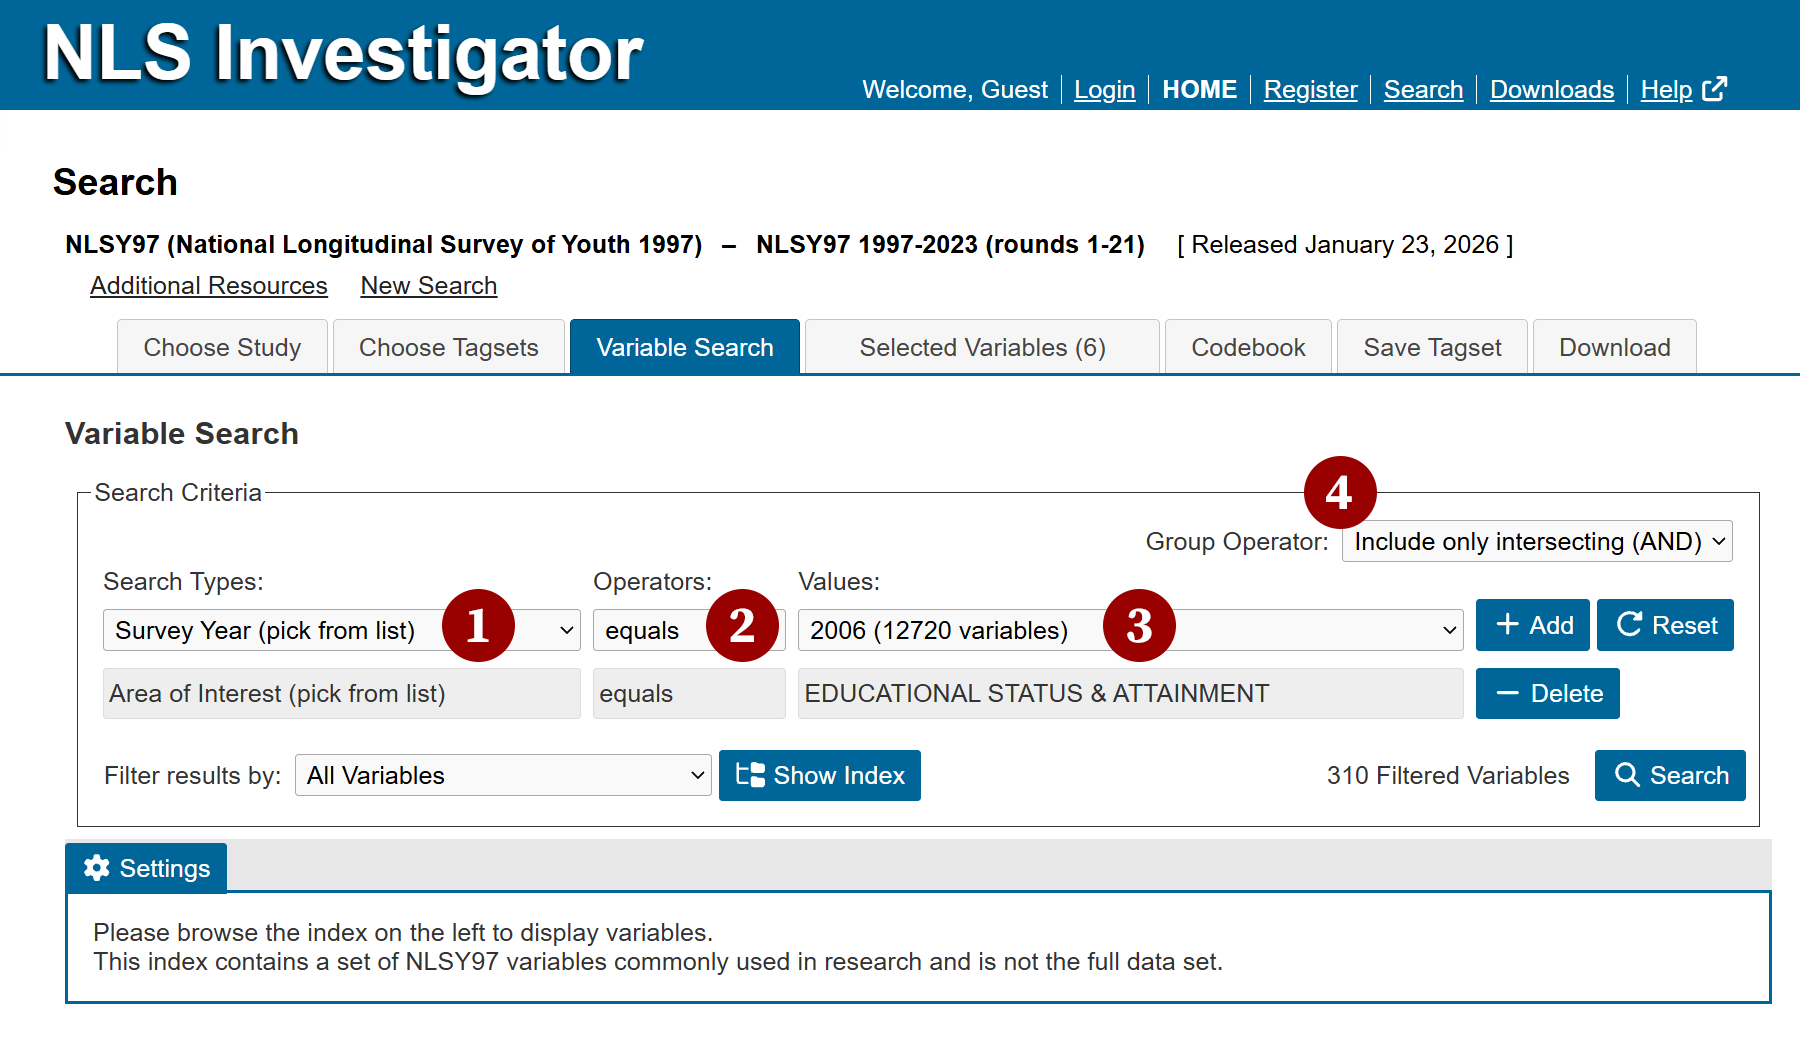
After you click Add in Step 2, the criterion builder creates a new row of fields below the first criterion so you can add a adsitional search parameters. Configure the fields as follows:
- In the leftmost field, select Survey Year.
- Next move to the Operators field and leave the default setting as equals.
- Then in the Values field, select 2006.
- With both search criteria selected, you can specify how they interact by choosing AND or OR from the Group Operator field located above the Add button.
- Leave the default setting, AND, unchanged for this demo.
- Using AND to combine Educational Status & Attainment and Survey Year = 2006 narrows the results to 310 Filtered Variables when Filter by results is set to All Variables. The filtered number (310) is listed to the left of the Search button.
Step 4: Display the search results
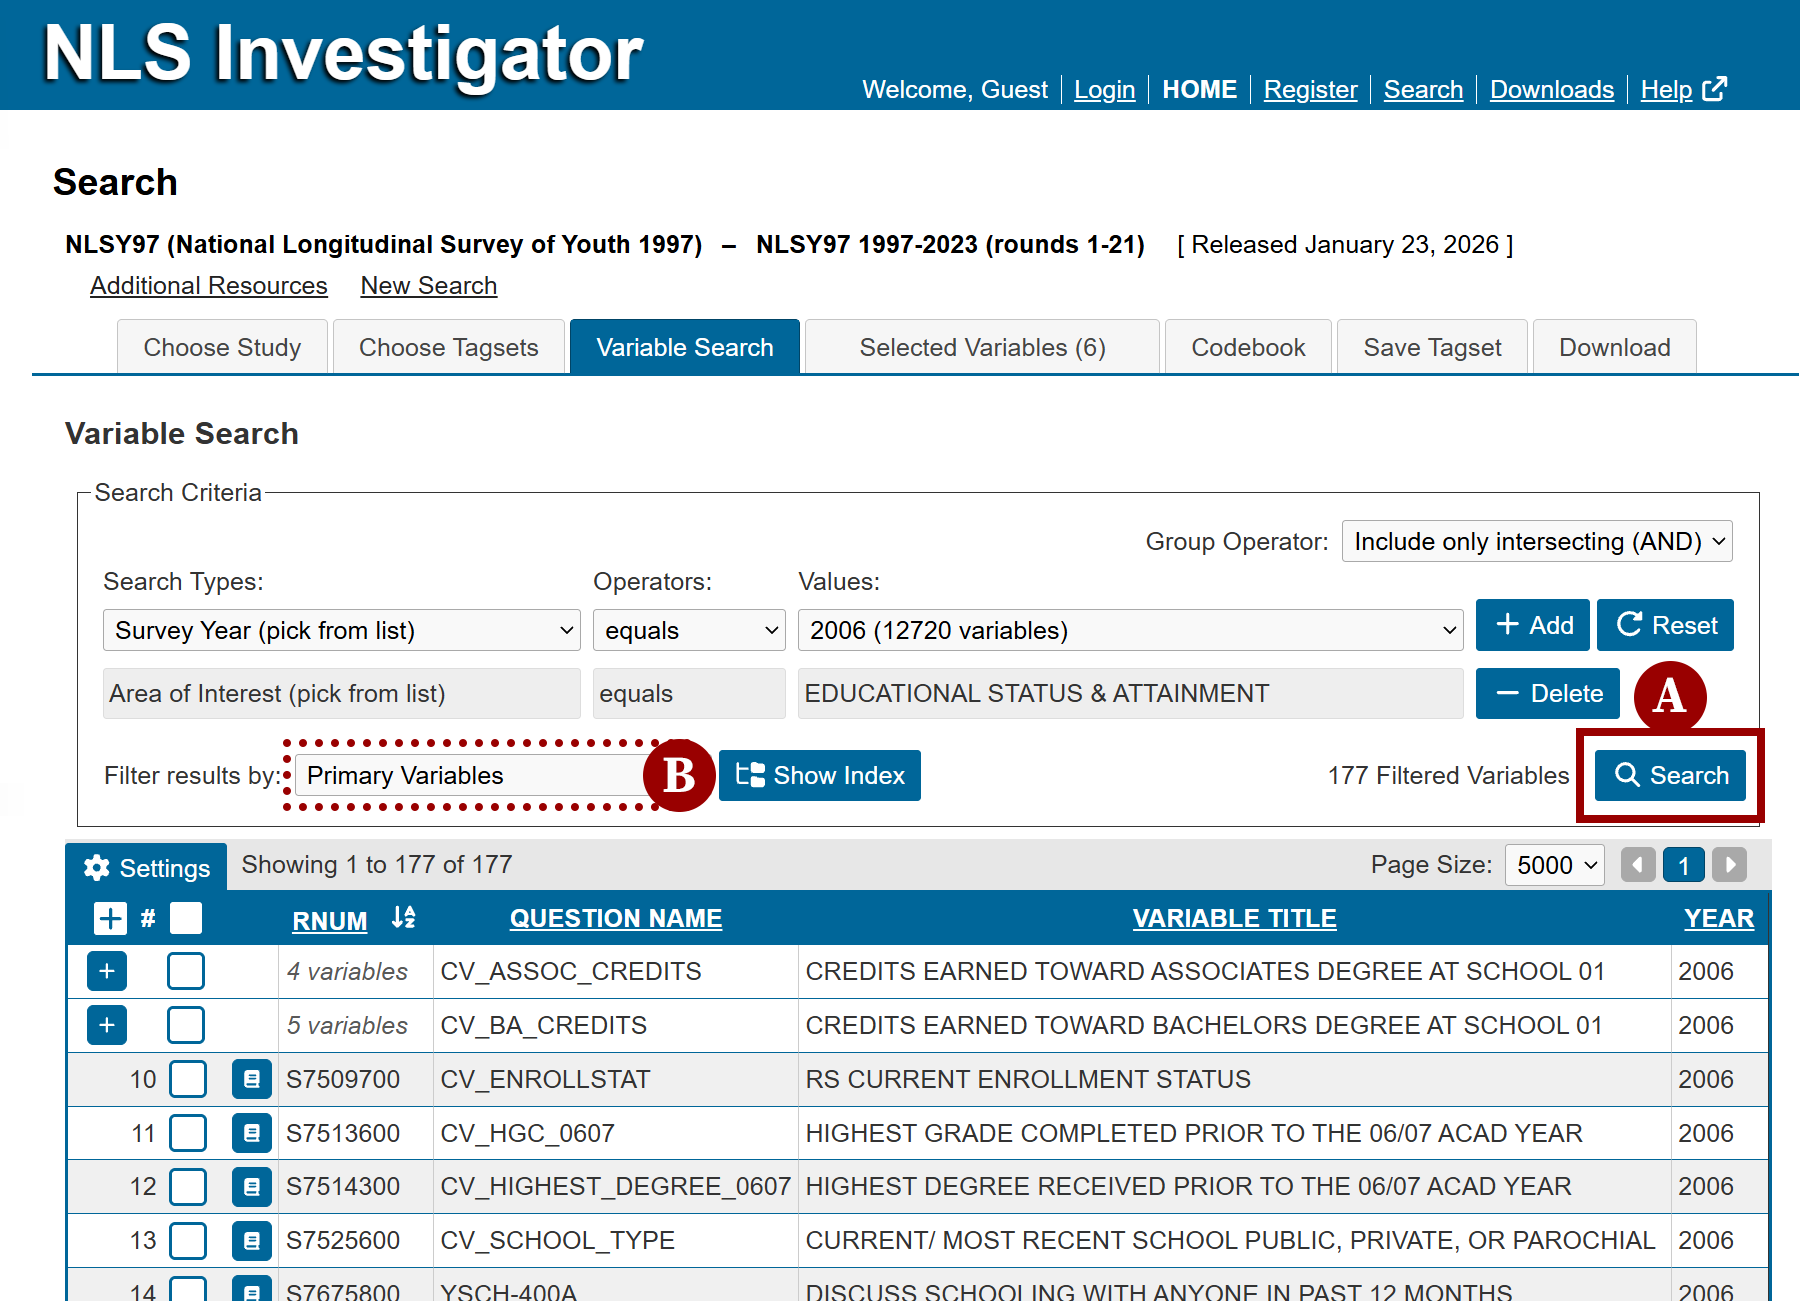
- Click Search to display the matching variables in the search results table. The table includes each variable's reference number (RNUM), question name, variable title, and survey year by default. Additional display options are outlined on the Customize Search Results page.
- When the filter is set to Primary Variables (the recommended preference level), 177 of the 310 matching variables are displayed. Filtering the variable preference level adjusts the scope of your results, either expanding or narrowing the list of returned variables. In this demo, the various filter levels display:
- Primary Variables: 177 of 310 variables
- Primary and Secondary Variables: 194 of 310 variables
- All Variables: 310 variables
Step 5: Select the variables of interest
Next, select four created variables (prefix CV_) to include in your tagset:
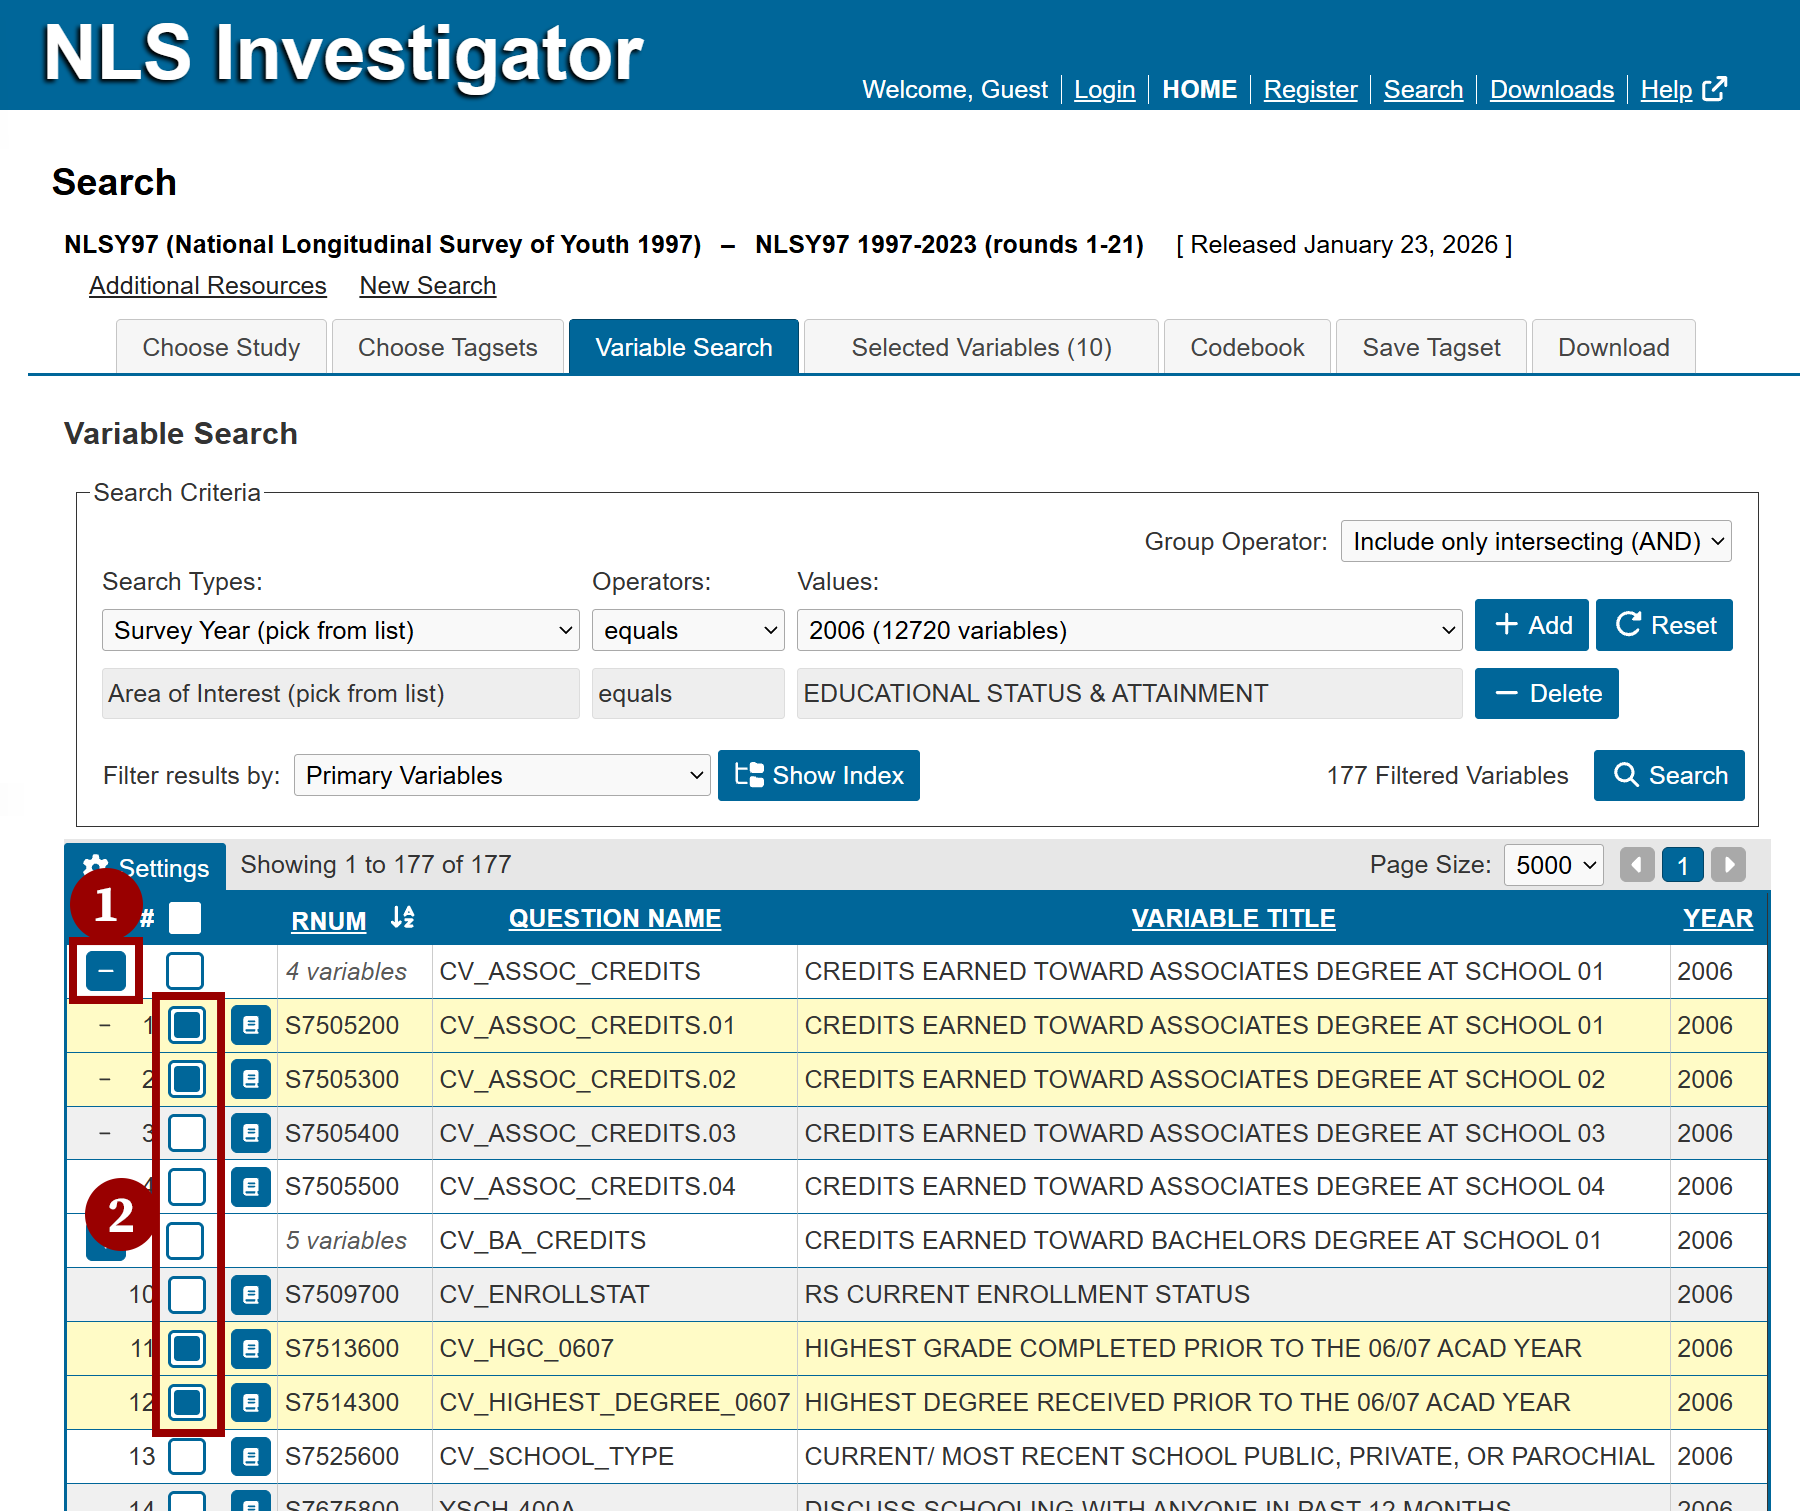
- Expand CV_ASSOC_CREDITS by clicking the + icon in the first column of the variable's row.
- Under CV_ASSOC_CREDITS, select S7505200 and S7505300 by checking the boxes to the left of each variable. Then select S7513600 (Highest Grade Completed) and S7514300 (Highest Degree Received) by checking the boxes next to those variables.
You should now have four variables selected for inclusion in your tagset.
Step 6: Review the selected variables
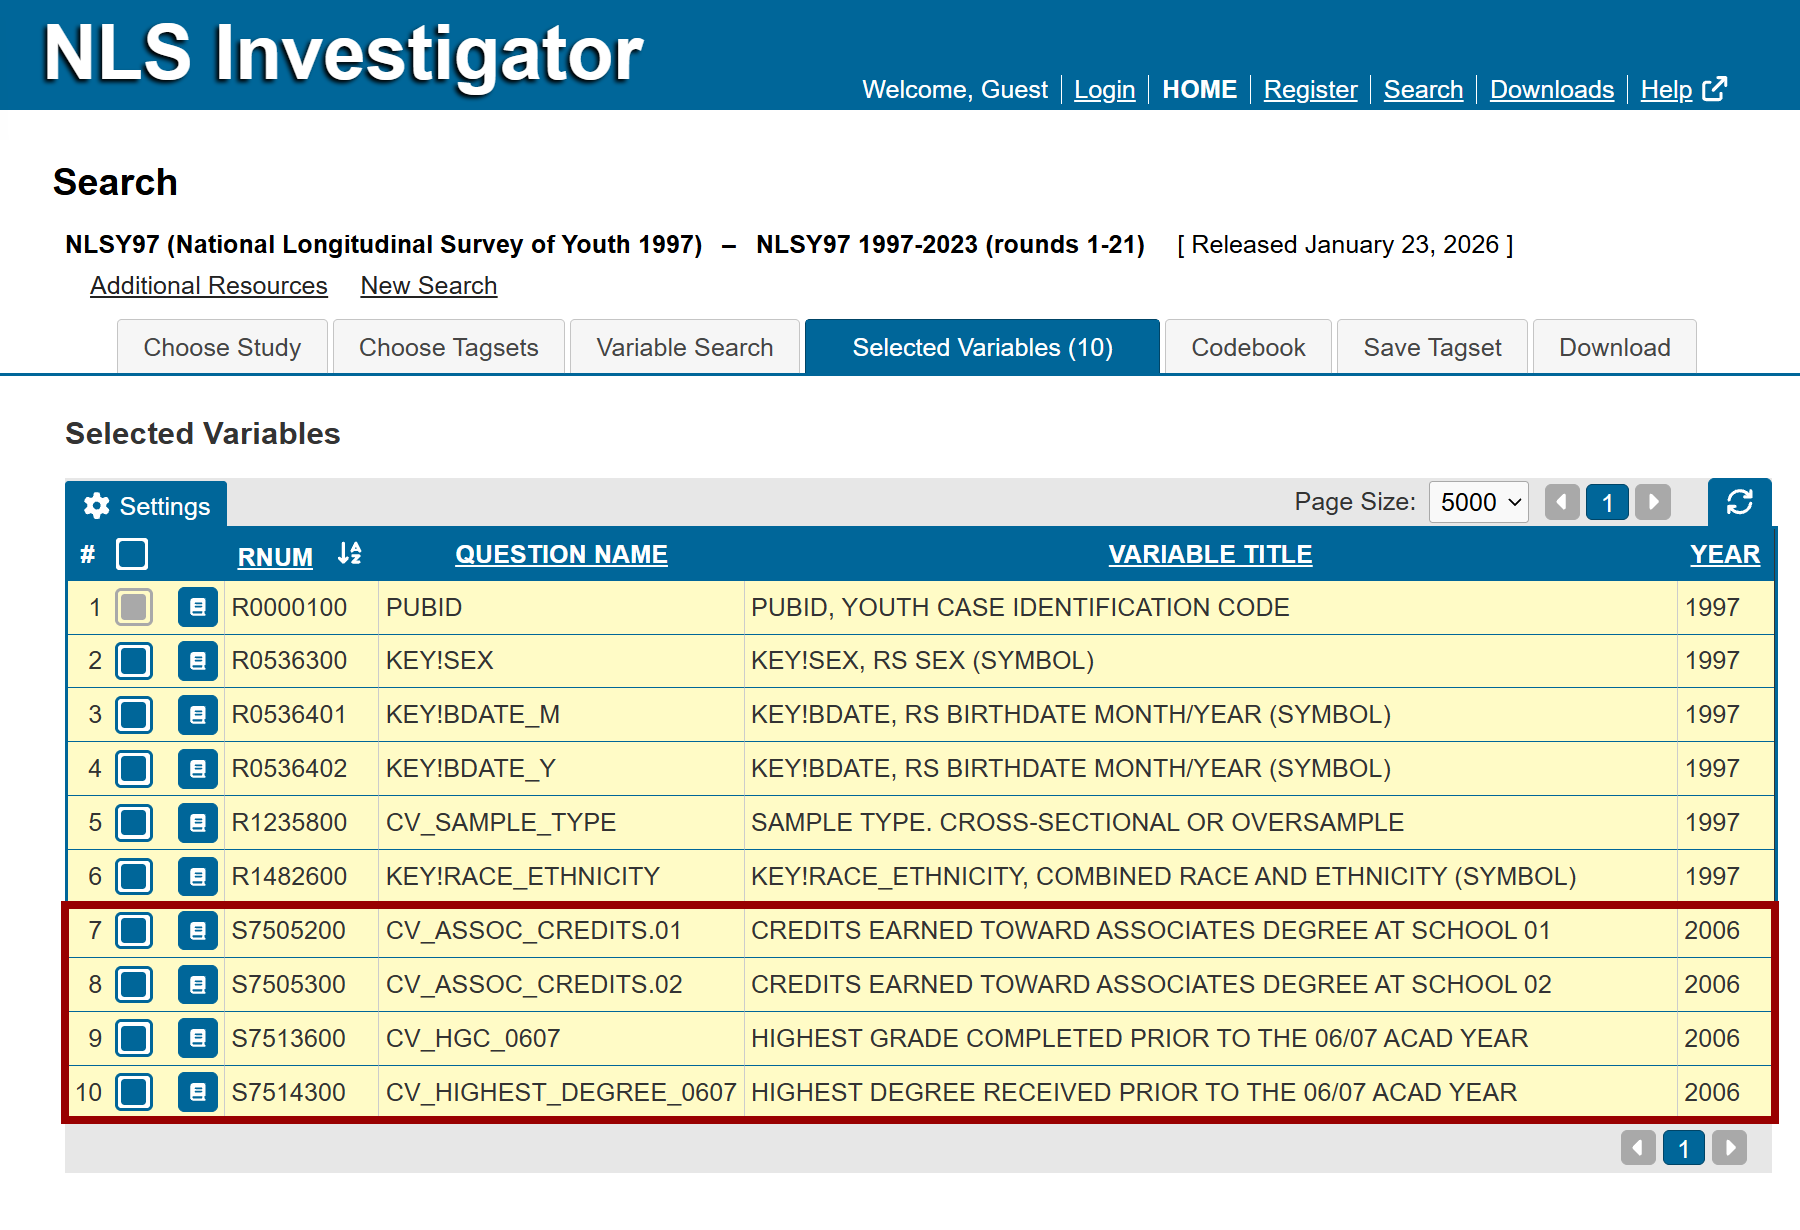
Open the Selected Variables tab to verify that all variables of interest have been added to your tagset.
For this demo, the list should contain 10 variables in total:
- 6 preselected variables: 1 required and 5 recommended
- 4 education variables selected in Step 4
Confirm that all 10 variables appear in the list before proceeding.
Step 7: Create a frequency distribution
Open the Frequency sub-tab within the Download tab and fill in the frequency details.
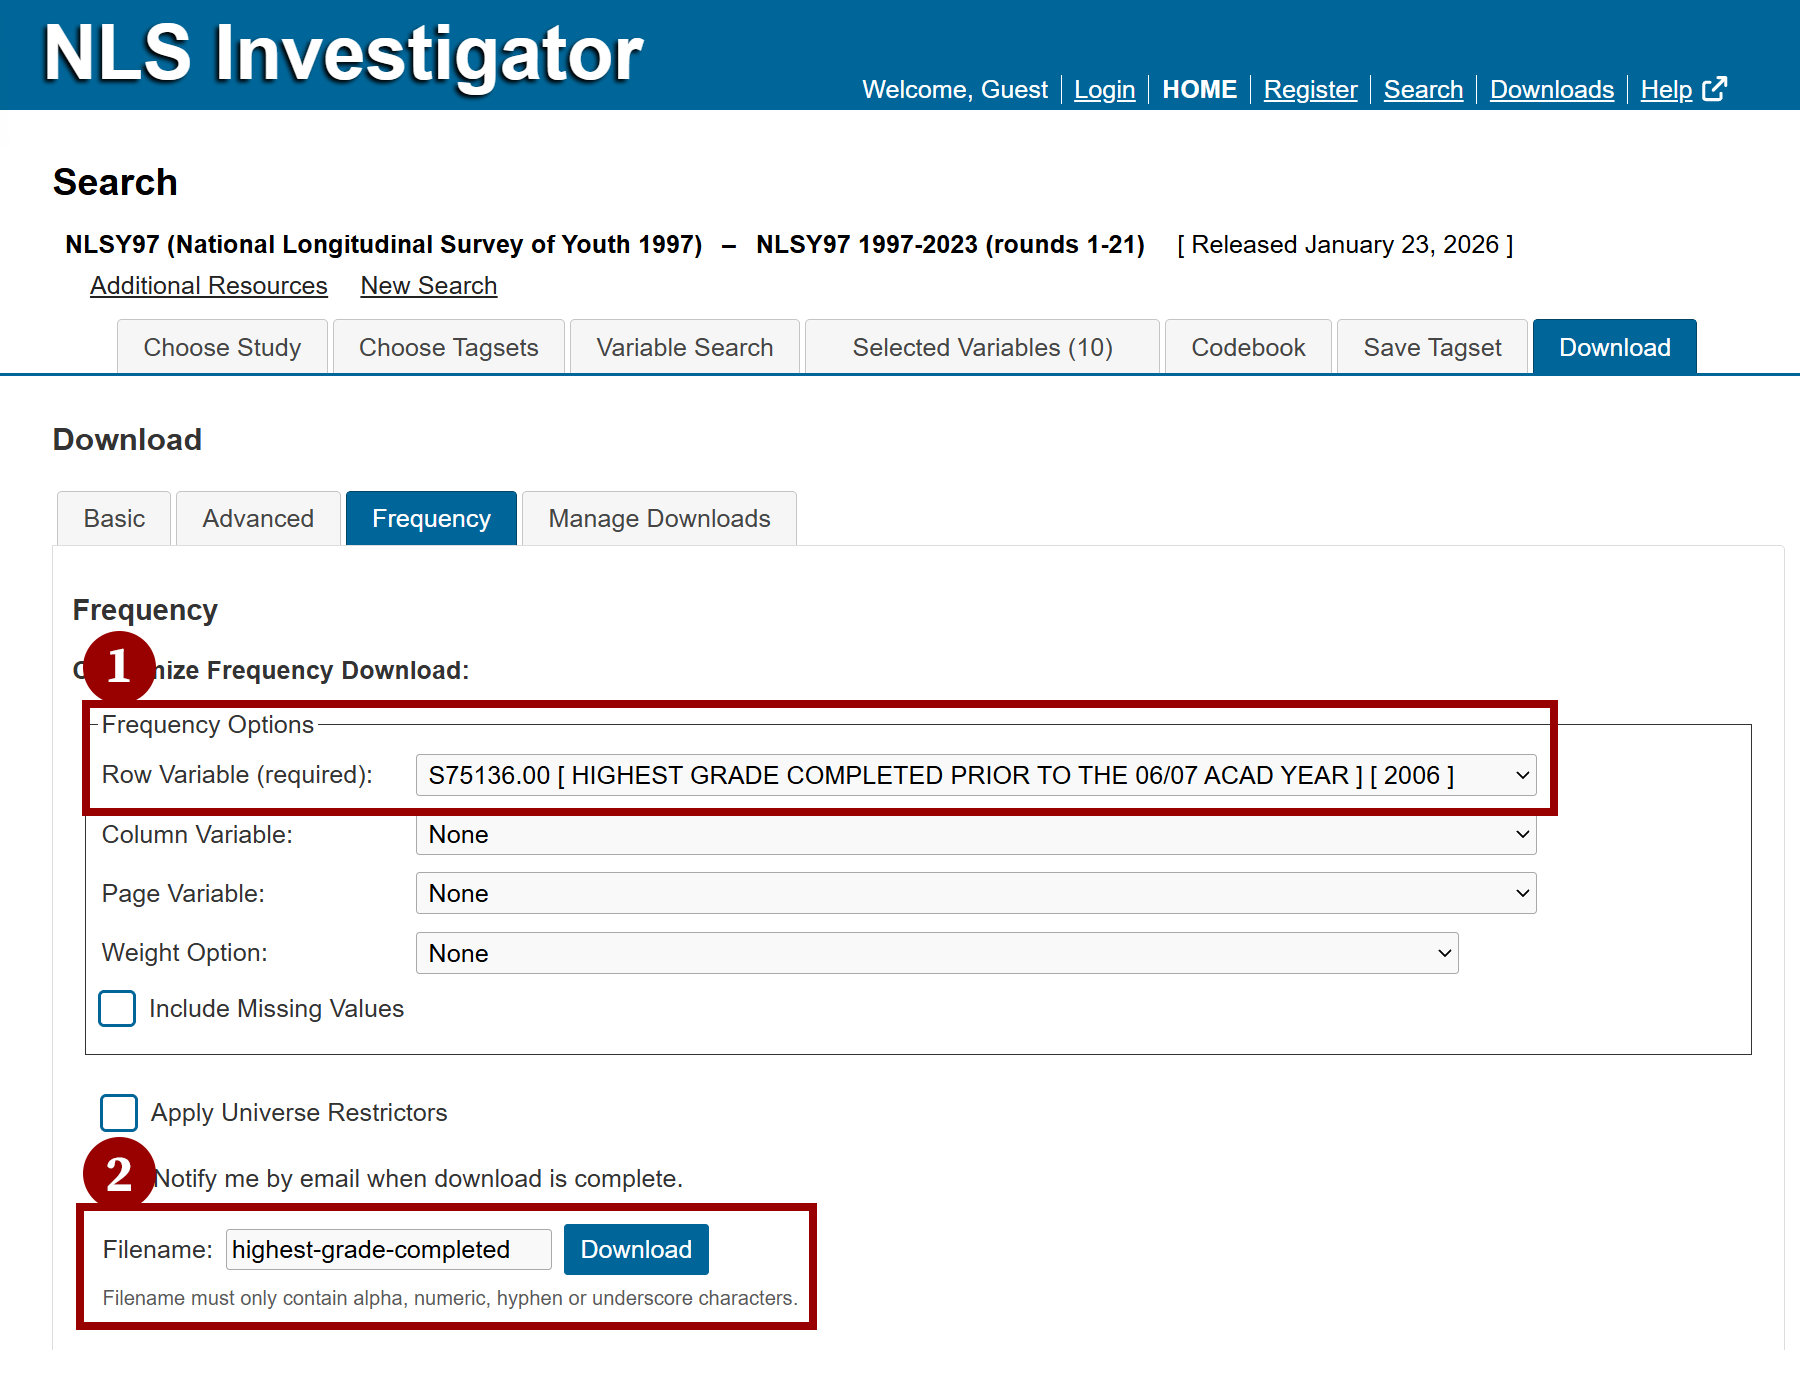
- In the Row Variable field, select S75136.00 (Highest Grade Completed) from the list of variables.
- In the Filename field, enter a name for the frequency distribution table (for example, 'highest-grade-completed') and click the Download button to generate and save the frequency distribution.
The resulting frequency table will show the number and percentage of respondents in each category of the Highest Grade Completed variable.
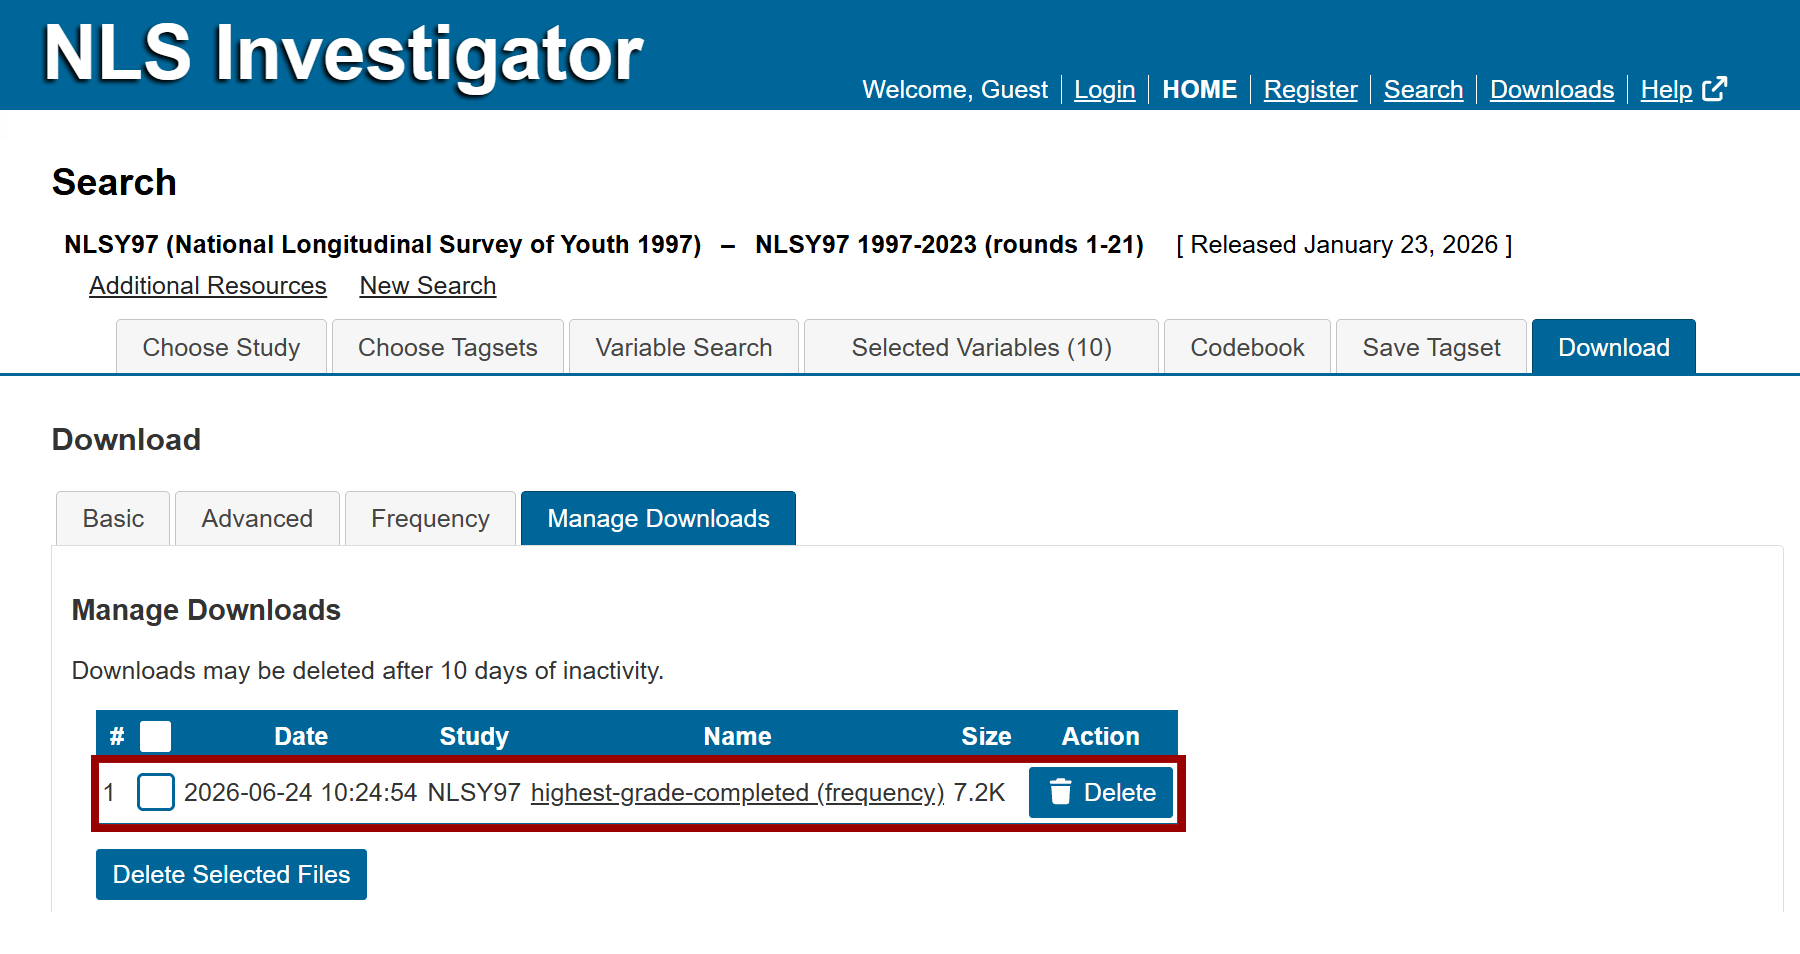
Use the Manage Downloads sub-tab to access the generated frequency table. Clicking the filename link will open the frequency table as an HTML file in a new browser window. Notes: Users may also right-click on the link to save the HTML file to their computers.
Frequency Output
| S7513600 | Frequency | Percent | Cumulative Frequency |
Cumulative Percent |
|---|---|---|---|---|
| 5 | 2 | 0.03 | 2 | 0.03 |
| 6 | 19 | 0.25 | 21 | 0.28 |
| 7 | 41 | 0.55 | 62 | 0.83 |
| 8 | 260 | 3.48 | 322 | 4.30 |
| 9 | 395 | 5.28 | 717 | 9.59 |
| 10 | 492 | 6.58 | 1209 | 16.16 |
| 11 | 586 | 7.83 | 1795 | 24.00 |
| 12 | 5680 | 75.94 | 7475 | 99.93 |
| 95 | 5 | 0.07 | 7480 | 100.00 |
| Frequency Missing = 1504 | ||||
Step 8: Apply universe restrictors
For this portion of the demo, use the variable R12358.00 to limit the analysis to respondents to the cross-sectional sample. In the Codebook tab, respondents included in the cross-sectional sample are coded 1 and account for 6,748 observations, while oversample respondents are coded 0 and account for 2,236 observations. Combined, these groups make up the full sample of 8,984 observations.
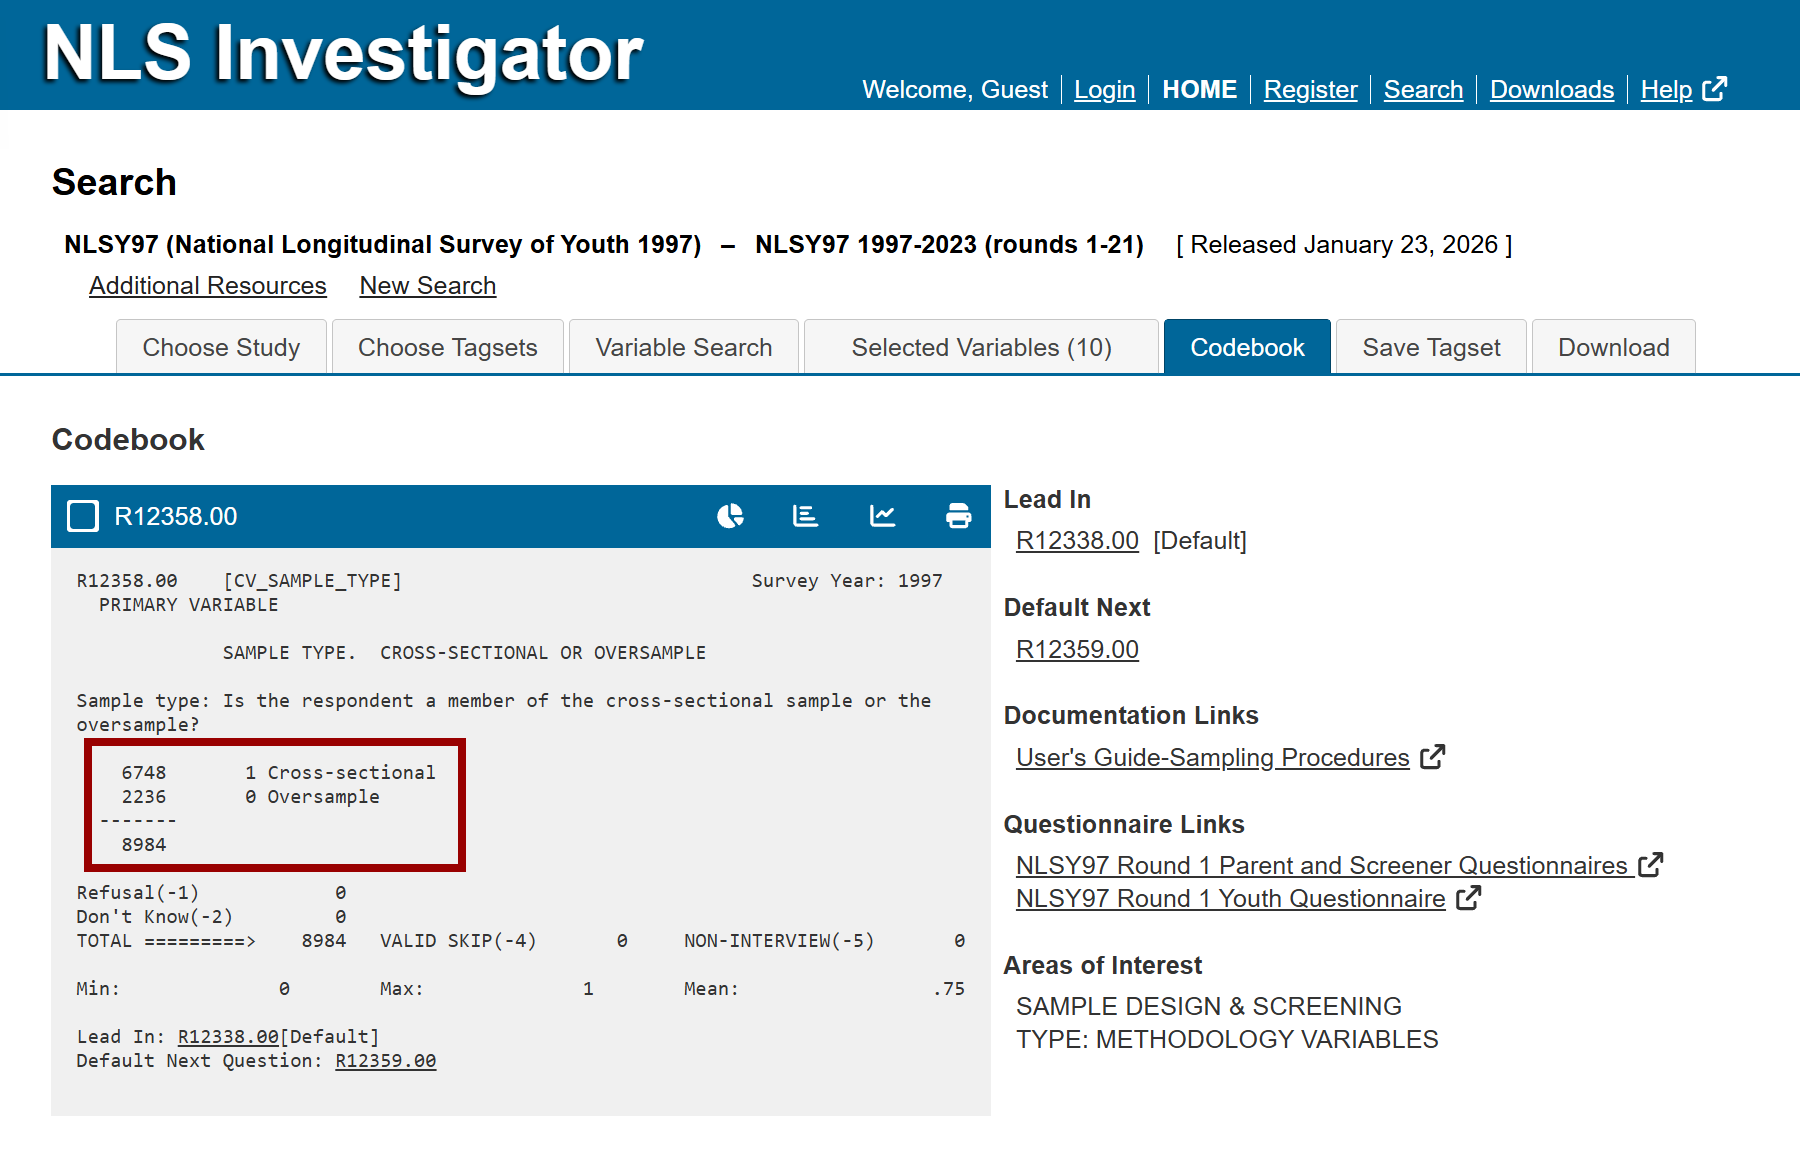
Access the Apply Universe Restrictors feature in the Advanced Download sub-tab. To restrict the dataset to the cross-sectional sample, select the Apply Universe Restrictors checkbox and enter R12358.00 = 1 in the Expression field (Marker A).
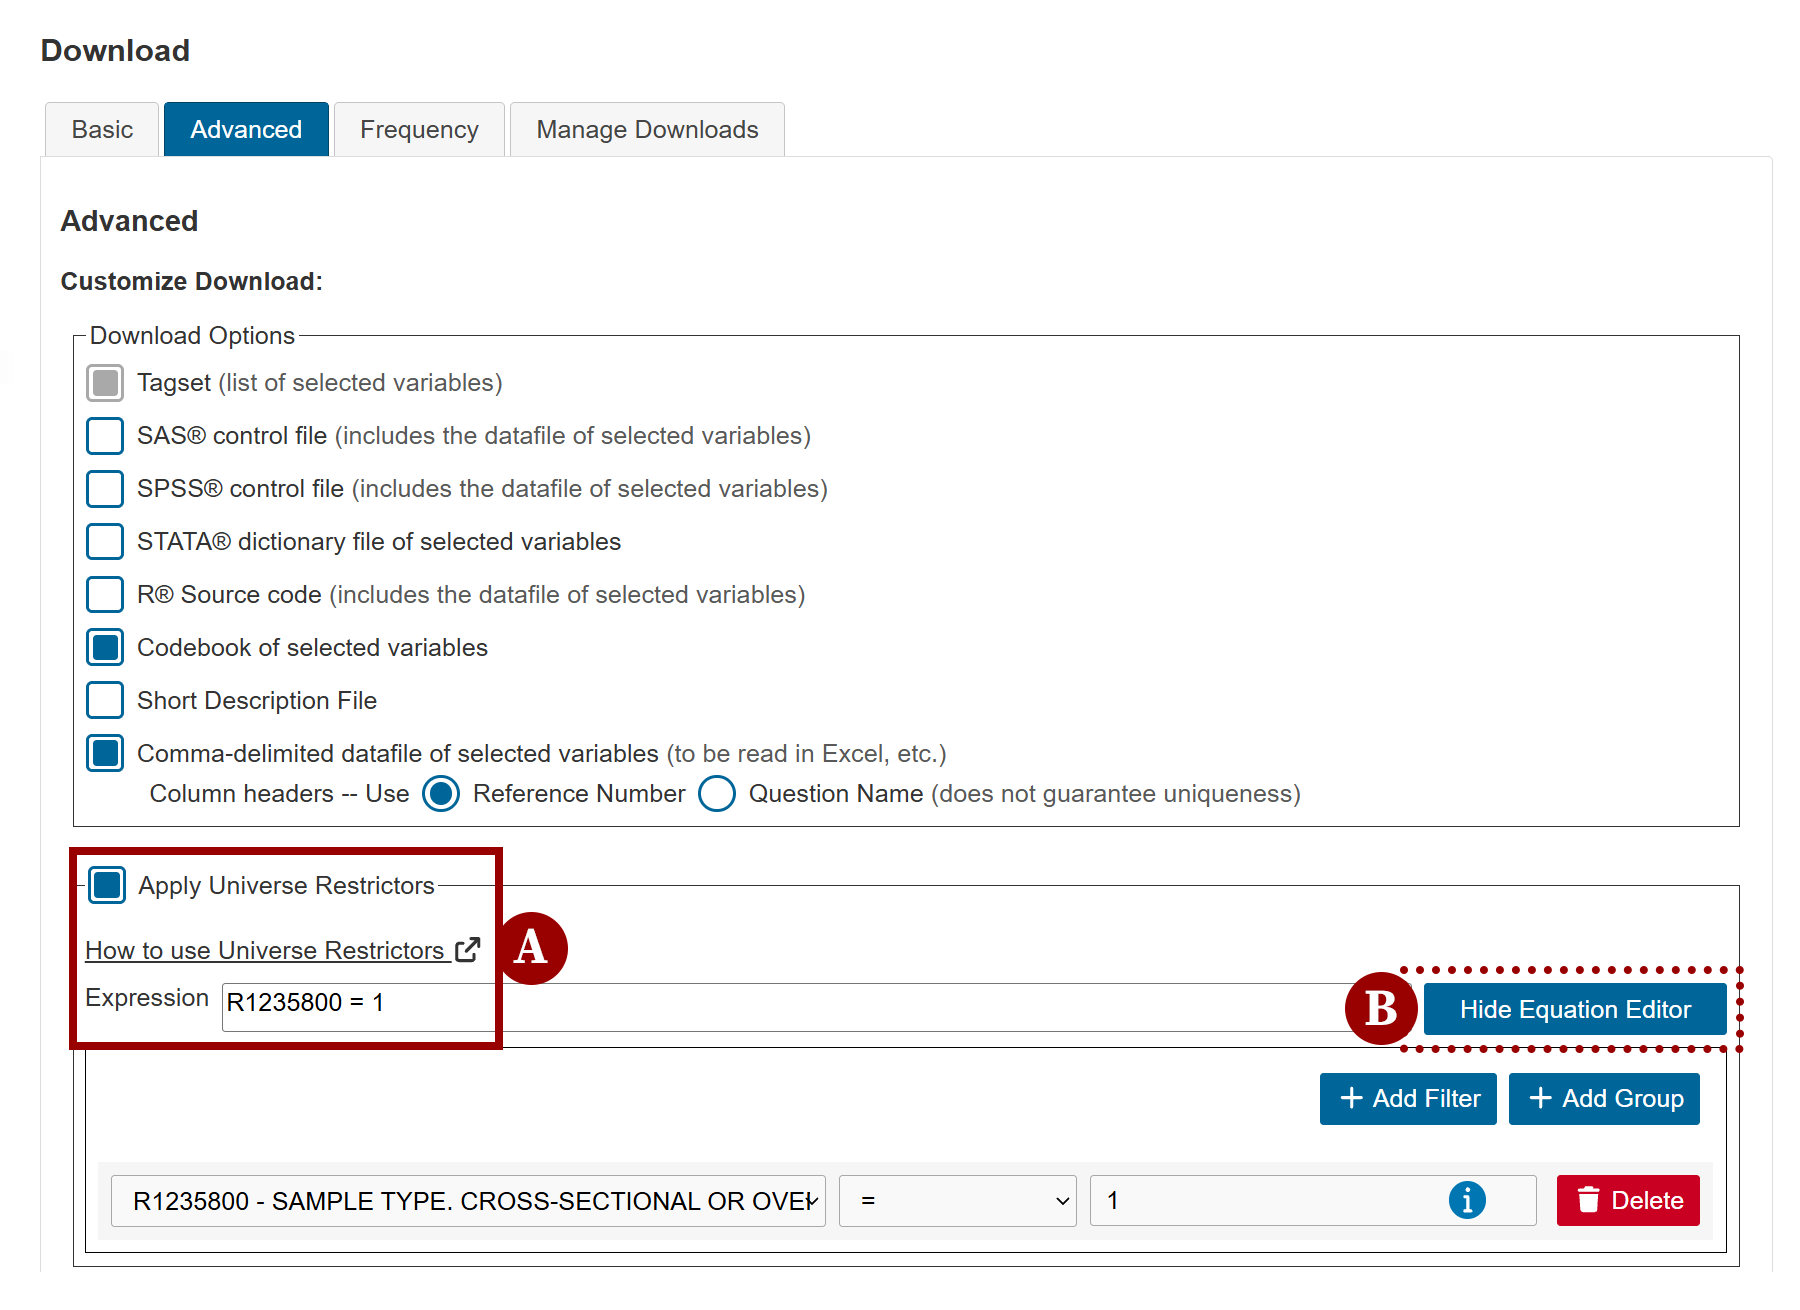
Alternatively, you may click the Show/Hide Equation Editor button (marker B) to build the expression. In the Equation builder fields from left to right:
- Select R12358.00 from the variable list
- Next choose the operator: equals =
- Then enter the desired value: 1 for the cross-sectional sample
- The equation should automatically load into the Expression field.
After setting the universe restrictor, enter a filename in the Filename field and click the Download button to generate the files. If no filename is provided, it will be labeled, default.
Note: Filenames may contain only letters, numbers, hyphens (-), and underscores (_). The downloaded files will be packaged in a .zip file.
Step 9: Accessing your extract
The Manage Downloads sub-tab opens to display the status of your extract. When processing is complete, a link to a .zip file appears using the filename you specified. Click the filename link to save the .zip file to your computer.
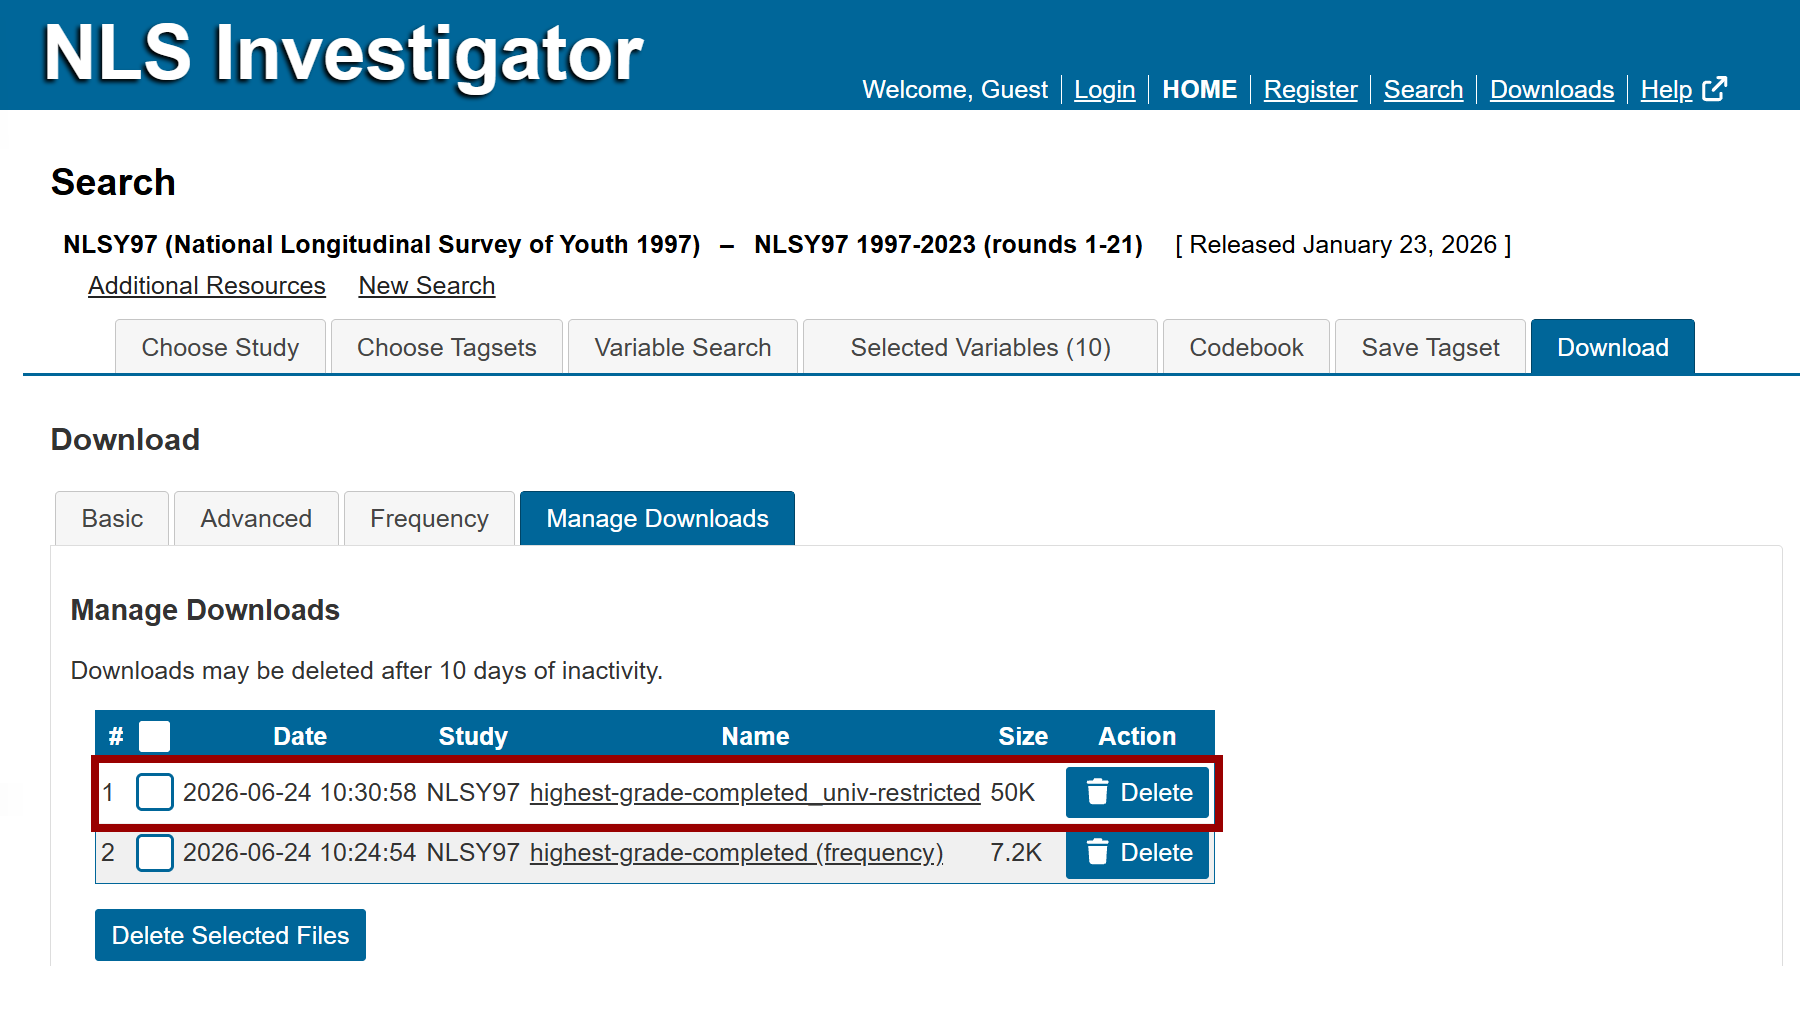
Additional information
The .zip file will contain several files based on the selections that you made in the Advanced Download sub-tab. An explanation of the of .zip contents can be found on the Customize Data Download page.
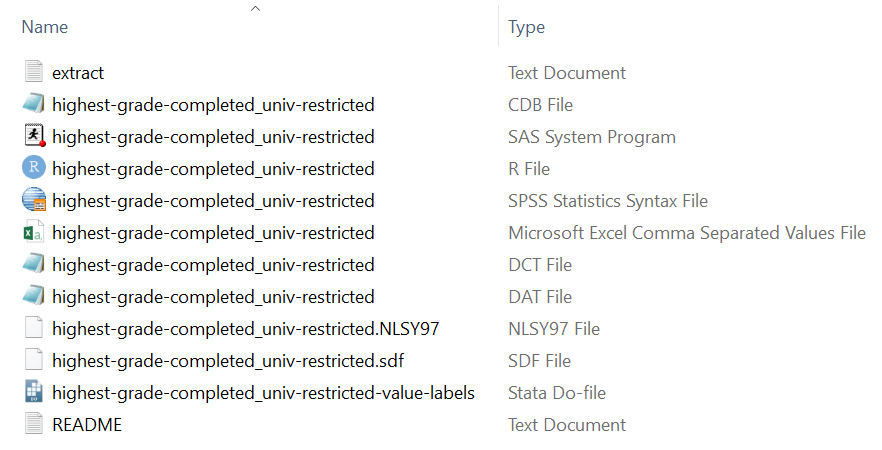
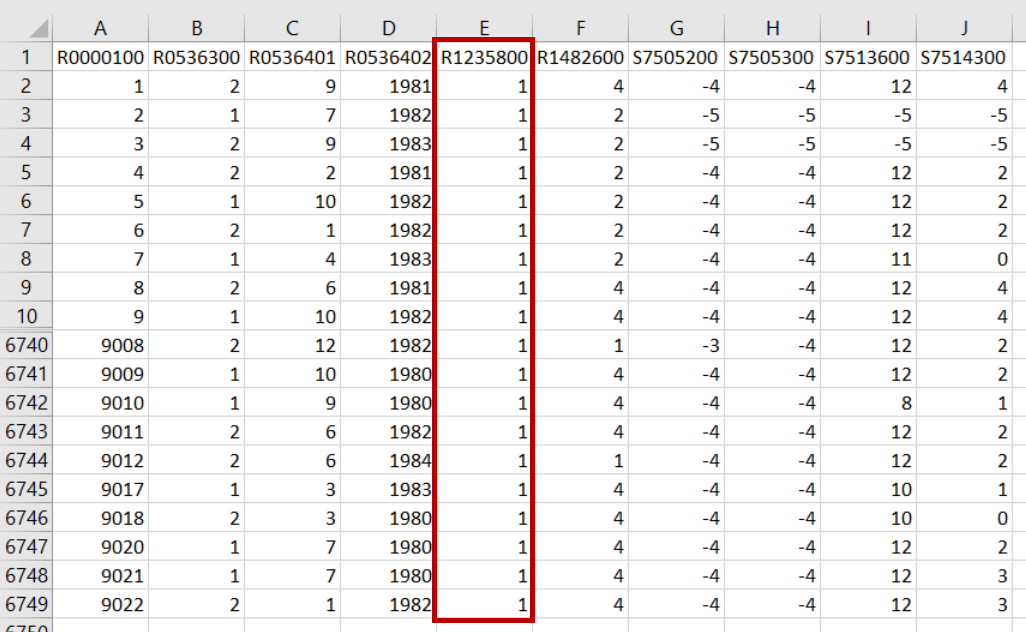
After downloading and extracting the .zip file, open the Excel file to verify that the universe restrictor was applied correctly. The resulting dataset contains 6,748 observations, all of which belong to the cross-sectional sample (identified in Column E). This represents the subset selected from the full NLSY97 sample, which contains 8,984 total observations. Because the universe restrictor was set to R12358.00 = 1, observations from the oversample were excluded from the extract.
Next: Video Tutorials
Previous: Importing Data
Quick links: Table of Contents | Glossary of NLS Terms